
Crypto Market Research: On-Chain Data, Not Hype
Data-driven research on how crypto markets really work – exchange flows, liquidity, volume quality, network activity and holder behaviour.

The $500M Volume Token With $200k of Real Liquidity
Picture a token’s page on a price tracker. Twenty-four-hour volume: $500 million. It looks like a market with real crowds and real money. Now open the…
Our approach to market research
We do not publish price predictions. Instead, we look at measurable data and explain what it can – and cannot – tell you. Public blockchains are an unusual gift for researchers: every transfer is recorded and can be analysed. Combined with exchange data, they show how money actually moves.
Metrics we work with
| Metric | What it measures | Main caveat |
|---|---|---|
| Exchange reserves | Coins held in known exchange wallets | Depends on how wallets are labelled |
| Active and new addresses | Network usage over time | One person can control many addresses |
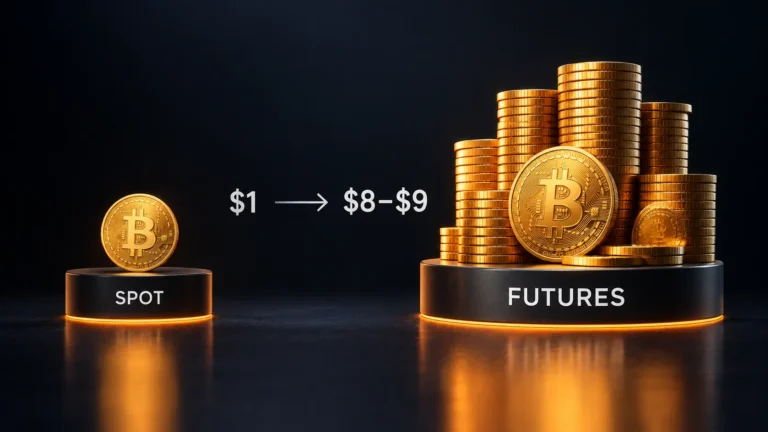
| Spot vs futures volume | Where trading activity happens | Reported volume can include wash trading |
| Market depth | How much can be traded near the current price | Order books change by the second |
| Hashrate and fees | Miner activity and demand for block space | Influenced by energy prices and hardware cycles |
Volume is not liquidity
Headline trading volume is one of the most misleading numbers in crypto. A token can report millions in daily volume while only a few thousand dollars can actually be traded near the current price. That is why our research looks at order-book depth and slippage, not just volume.
How to read on-chain data
- Addresses are not people – exchanges and custodians hold coins for millions of users.
- Large transfers are often internal wallet movements, not buying or selling.
- Labels for exchange and whale wallets come from analytics providers and can be incomplete.
- A single metric rarely explains a price move; look for confirmation from several sources.
Methodology and sources
Each analysis states its data source, time period, method and limitations, so you can judge the result yourself. We use public blockchain data, block explorers, exchange APIs and established analytics providers, and cite them in every article.
Why on-chain data is different
Traditional market data mostly comes from exchanges. Crypto adds a second, public layer: the blockchain itself. It shows when coins move to or from exchanges, how long holders keep them and how actively a network is used. Read carefully, the two layers together give a fuller picture than either alone.
Topics we cover
- Bitcoin holders, whales and exchange reserves.
- Trading volume quality and real liquidity.
- Network activity, retention and transaction failure rates.
- Stablecoin flows and their role in market liquidity.
- Market crashes and what they reveal about market structure.
Our in-depth studies are collected in the crypto analyses section.
Risks to keep in mind
Market research describes what happened; it does not tell you what will happen next. Crypto assets are highly volatile and largely unregulated – never invest money you cannot afford to lose.
Frequently asked questions
Do you give trading advice?
No. Our research explains data and market structure. Nothing on Blockchaindose is financial advice.
Where does your data come from?
We use public blockchain data, block explorers, exchange APIs and established analytics providers, and cite the source in every article.
What are exchange reserves?
Exchange reserves are the amount of a coin held in wallets attributed to exchanges. Falling reserves are often read as coins moving into self-custody, but labelling is imperfect.
This page is for educational purposes only and is not financial, investment or tax advice. Crypto assets are volatile and you can lose all of the money you invest.