
Crypto Analyses: In-Depth On-Chain Studies
Each analysis takes one question and answers it with data – from Bitcoin exchange reserves and whale behaviour to liquidity, volume quality and network activity.
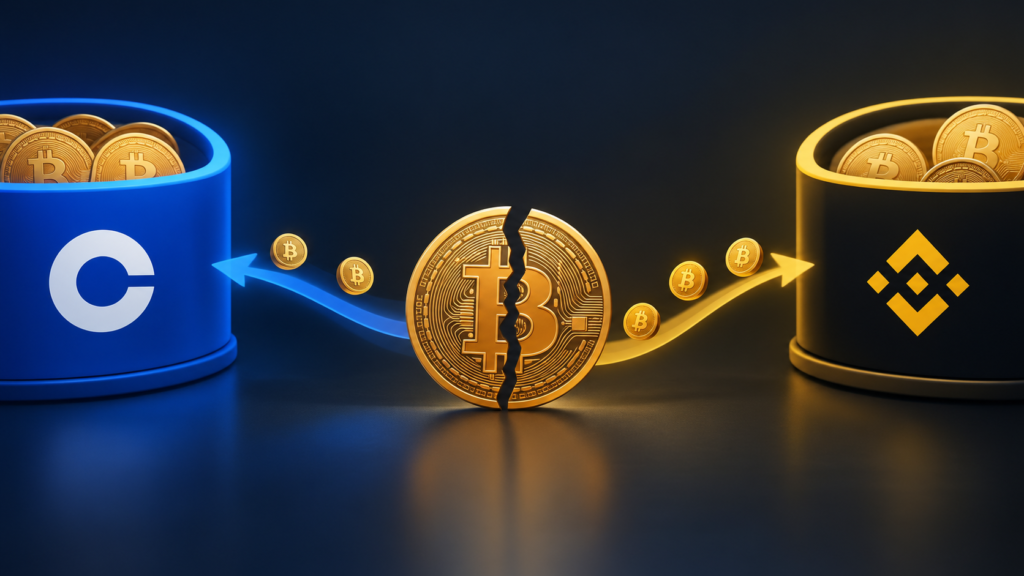
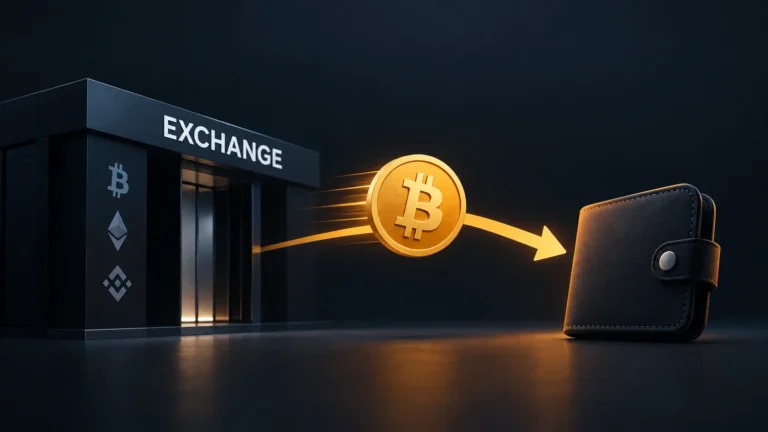
The Coinbase Binance Liquidity Split: Bitcoin’s Exchange Reserves Are Fragmenting
For years, exchange reserves was one of crypto's simplest signals. If Bitcoin leaves exchanges, holders are hoarding. If it flows in, they're getting ready to sell.…
What makes an analysis
Our analyses follow a simple structure: the question, the data and method, the findings with charts, and the limitations. We prefer narrow questions that can be answered with evidence – such as how many coins sit on exchanges or how thin an order book really was during a crash – over broad market commentary.
Recurring themes
| Theme | Example questions |
|---|---|
| Bitcoin supply and holders | How much BTC sits on exchanges? What are large holders doing? |
| Volume and liquidity quality | How much reported volume is real? How deep are order books? |
| Network activity | How many addresses are active, and how many keep coming back? |
| Market events | What did a crash look like on-chain and in order books? |
| Ecosystem health | How often do transactions fail? How many tokens survive launch? |
How we work with data
- We state the data source and the time period for every chart.
- We compare several sources when they disagree, and say so.
- We separate what the data shows from our interpretation of it.
- We update recurring analyses when new data becomes available.
How to use our analyses
Use them to understand how markets and networks behave, not as trading signals. A metric that looked meaningful in one market cycle may lose its value in the next, especially when exchange wallets change or new products such as ETFs shift where coins are held.
Examples of questions we have answered
- How many bitcoins are held on exchanges, and how has that changed?
- How much of a token’s reported trading volume could actually be executed?
- How many new Bitcoin addresses appear each day, and how many stay active?
- How often do transactions fail on high-throughput chains?
- What share of new meme tokens on launchpads ever reach a liquid market?
Reading the charts
Charts in our analyses always show the unit, time period and source. Where a metric depends on wallet labels, we say which provider supplied them. When numbers come from exchanges, remember that reporting standards differ: some include fees or internal transfers, and some exchanges have historically inflated volume.
If you spot a mistake or have better data, contact us – we correct errors openly and note the date of each update.
Risks to keep in mind
On-chain labels and exchange data are imperfect, and short time windows can exaggerate trends. Crypto assets are highly volatile; nothing in these analyses is investment advice.
Frequently asked questions
How often do you publish analyses?
We publish new analyses several times a week and update recurring studies when new data is available.
Can I use your charts?
Yes, with a credit and a link to the original article.
Why don’t you include price predictions?
Because data describes the past and present. We focus on explaining market structure rather than forecasting prices.
This page is for educational purposes only and is not financial, investment or tax advice. Crypto assets are volatile and you can lose all of the money you invest.