


Over the 12 months to June 30, 2026, crypto price, and value plunged by about a half. Roughly $2.1 trillion disappeared from total market capitalization, making it the worst bear market since 2022. Yet over the same stretch, the amount of money actually moving through crypto hardly changed. Chainalysis measured the global crypto economy at $9.4 trillion, down just 1.6% from $9.5 trillion.
That is the quiet story of global adoption in 2026. Prices made the headlines. Usage held on.
Two numbers that look like they should match
They measure different things, and the gap between them is the story.
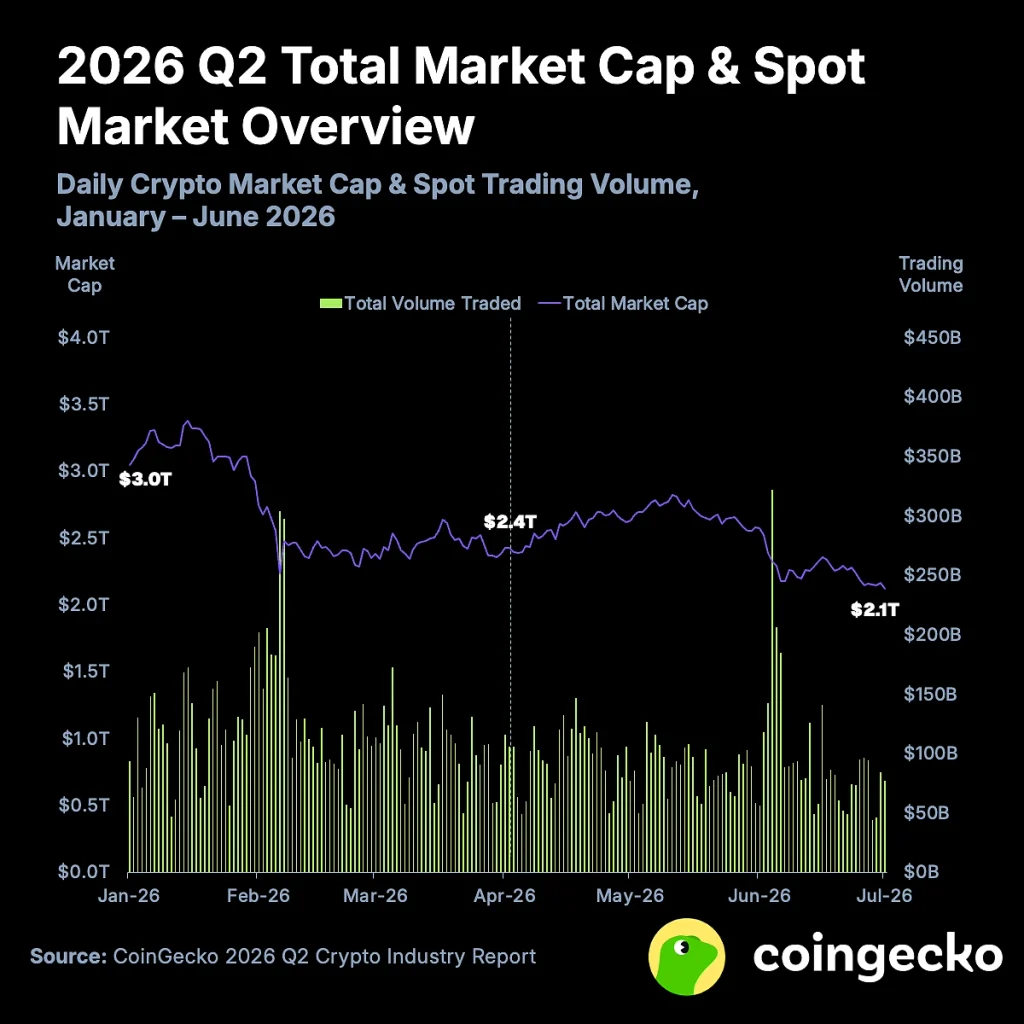
Market cap is the price of every coin multiplied by how many exist. It is a mood: how much people are willing to pay on a given day. Economic activity is money in motion: trades, transfers, payments, and deposits. It is closer to use than to sentiment.
On the mood side, CoinGecko’s data shows total market cap peaked near $4.4 trillion in October 2025 and ended June 2026 at $2.1 trillion, about 52% lower. A violent unwind of borrowed money helped start the slide. CoinGlass counted around $19 billion in liquidations over October 10–11, 2025, among the largest ever recorded.
On the use side, Chainalysis says activity slipped only 1.6% over the year to June 2026. One caution up front: these two percentages are not directly comparable. One tracks the value of coins. The other tracks the flow of money. But set side by side, they tell you something prices alone cannot.
Claim one: global adoption held up
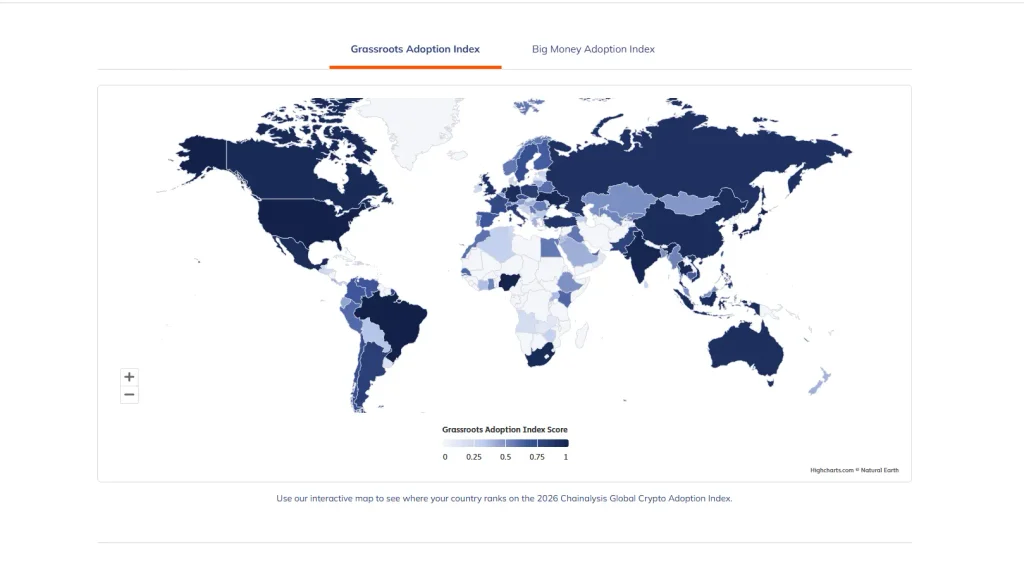
The best proof is how this bear market compares with the last one. According to Chainalysis figures reported by The Crypto Times, in the 2023 downturn crypto activity fell 23%, about $1.2 trillion, while market cap dropped only about $0.3 trillion. This time it flipped: a huge fall in value, a tiny fall in activity.
The regional numbers point the same way. Chainalysis reports that Latin America’s crypto economy grew 9.8% to $593.8 billion. Venezuela’s jumped 107.2% to $39.1 billion. Brazil topped the new 2026 adoption index with a $252.5 billion crypto economy, followed by the United States and Nigeria. The index now ranks 117 countries on four measures: service inflows, person-to-person transfers, cross-border flows, and on-chain balances.
Note that this growth is not evenly spread. Brazil’s own activity slipped 1.6% even as it took first place. Adoption is increasingly a story of countries where people use crypto for daily money needs, not only to speculate.
Claim two: stablecoins did the heavy lifting
Stablecoins, tokens pegged to the dollar, are the clearest reason activity held. Chainalysis found peer-to-peer stablecoin transfers surged 302.9% to $228.7 billion in the year to June 2026, and stablecoins made up 96% of that peer-to-peer volume.
Other aggregators see the same pattern:
- Visa’s on-chain dashboard (built with Allium, Artemis and Castle Island Ventures) logged a record $1.79 trillion in adjusted stablecoin volume in June 2026. That was up 63% from May and up 125% from a year earlier, in the very month prices sat near their lows.
- Chainalysis found stablecoin balances stayed in a narrow $98–109 billion band while total on-chain balances fell from $860 billion in September 2025 to $440 billion in June 2026.
- Coinbase and Glassnode reported that in Q1 2026, crypto market cap excluding stablecoins fell about 18% while stablecoin supply rose from $308 billion to $318 billion. Their read: money was rotating into stablecoins, not leaving crypto.
- CoinGecko’s 2025 annual report showed stablecoin market cap up 48.9% in 2025 to a record $311 billion.
In plain terms, when prices fell, many people did not walk away. They moved into dollars on-chain and kept using the system.
Where the story gets weaker
A good claim should survive a hard look. This one mostly does, but not without scratches.
Some activity did fall. Chainalysis says money flowing into exchanges, DeFi and other crypto services fell 4.3%, from $9.3 trillion to $8.9 trillion. And the on-chain balances that halved are a real loss of parked capital.
Stablecoins weren’t immune. CoinGecko’s Q2 2026 report says stablecoin market cap slipped 1.6% to $305.1 billion, the first drop since Q3 2023, which it called a sign of capital leaving the industry. Trackers measure supply slightly differently, so exact figures vary between sources, but the direction in Q2 was soft.
Fewer people may be doing the activity. Glassnode data cited in market reports showed Bitcoin’s daily active addresses down roughly 31% between August 2025 and late February 2026. In April, CryptoQuant flagged the lowest count since 2016, and Glassnode’s own 24-hour reading was about 661,000. Flat money flows with fewer active wallets suggests larger players, such as funds and institutions, carrying more of the load.
The $9.4 trillion needs care. It combines several types of flow, so the same dollar can appear through more than one lens. One outlet noted Chainalysis had not published the full breakdown of the figure in its summary. So it is best read as “measured crypto-economic activity,” not GDP and not a simple count of payments.
Real payments are still small. McKinsey and Artemis estimated actual stablecoin payments at about $390 billion a year, roughly 0.02% of global payments. Most stablecoin volume is trading, internal transfers or automated activity. Visa’s data shows the gap: about $75.7 trillion in raw volume over 12 months versus $12.9 trillion once bots and repeat patterns are filtered out.
Trading cooled. CoinGecko says spot volume on the top 10 exchanges fell 14.2% in Q3 2026 to $1.65 trillion, even as market cap bounced 39.6% to about $2.96 trillion.
The verdict: Crypto Price Fell
“Value fell, economy held” is a fair summary if “economy” means measured on-chain activity, led by stablecoins and by users in emerging markets. It is too generous if it suggests that more people, or more everyday payments, were driving it. The honest version: price collapsed, usage did not, and the usage that stayed is concentrated, dollar-linked and still small next to traditional payments.
Why it matters
Crypto price charts are what most people watch, and they only measure sentiment. Activity data shows whether crypto is actually being used. In 2026 the two split apart, which means a falling market doesn’t automatically mean falling adoption. If you build, invest, regulate or report on this space, you need to track both numbers, and know which one you’re looking at.

Dan is a seasoned crypto writer for Blockchaindose who got his start in the space back in 2019. Over the past four years, he’s built a solid grasp of how the industry moves, focusing heavily on DeFi, NFTs, GameFi, and promising new projects.
Off the clock, you’ll usually find him buried in a good book or kicking back with a movie. His blend of hands-on market experience and straightforward commentary makes him a clear, trusted voice across the platform.