


In November 2025, perpetual futures tied to stocks, ETFs, indices, gold and oil made up just 0.5% of perpetual volume on major crypto exchanges. By August 2026 that share had reached 23.5%, with about $778 billion traded in that month alone, up from $23.5 billion in November, according to Glassnode and Fasanara Digital. That is roughly 33 times more volume in nine months.
A perpetual future (a “perp”) is a contract that tracks a price without an expiry date. Traders bet on whether gold, Nvidia or the S&P 500 goes up or down, using crypto rails and often a crypto-dollar as collateral. They never own the underlying asset.
The part the headline hides
The share jumped from 0.5% to 23.5%, but not only because Wall Street products boomed. Trading in crypto-asset perpetuals fell 49% over the same period, which also lifted the traditional-asset share.
So the true story is two moves at once. Traditional-asset volume exploded while crypto-native trading cooled. The 23.5% figure is real, but it is partly a story about crypto’s own slowdown.
Who is counting matters
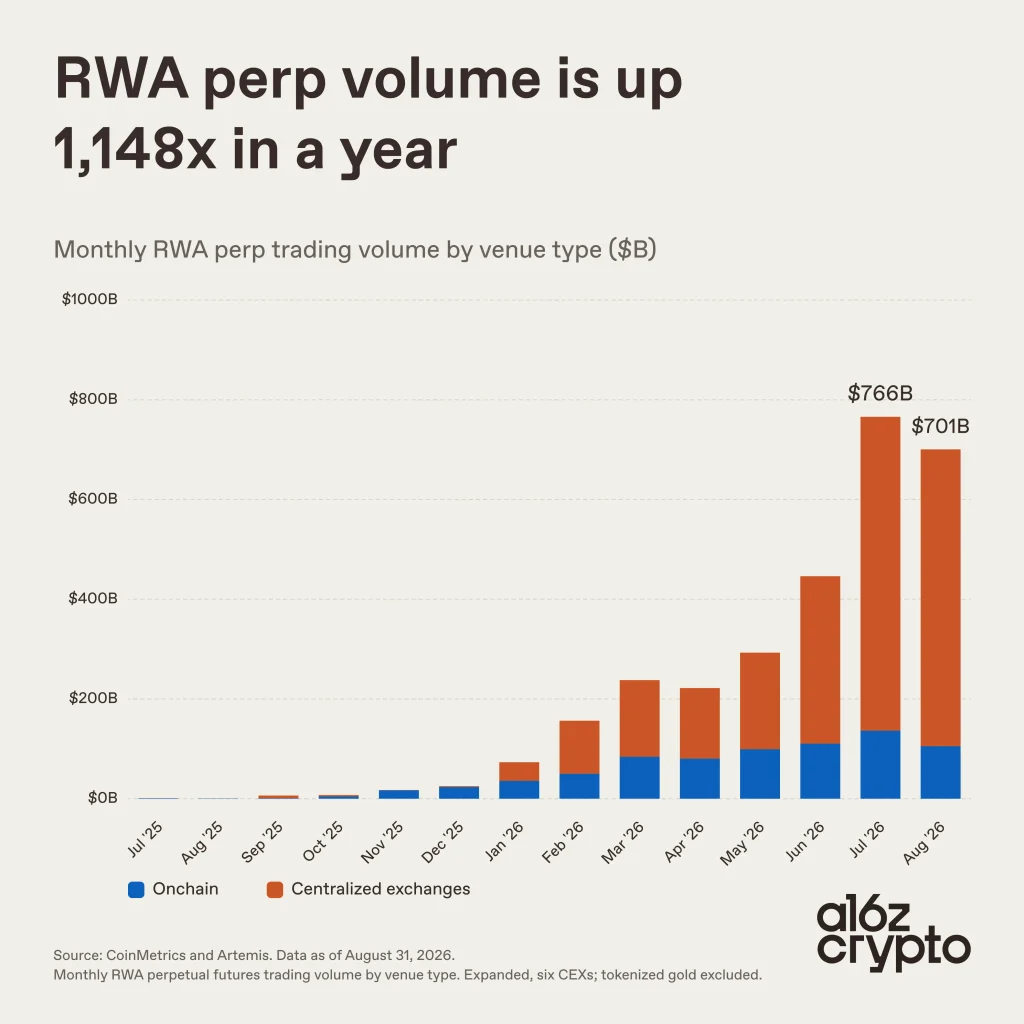
Different data providers report very different totals, because each tracks different venues and contracts.
- Glassnode and Fasanara’s $778 billion covers six major exchange groups.
- CoinMarketCap Research puts August at $799.5 billion, a record, and says cumulative volume since late December has passed $3.16 trillion.
- a16z, tracking a narrower set of venues, counts $117.3 billion in August, still up 44 times from a year earlier.
All three show the same direction, with a steep climb and a record-setting summer, but the size depends on the definition.
They also disagree on where the action is. a16z found 86% of volume in its tracked group, about $101 billion, happening on-chain, versus roughly $16 billion on centralized exchanges. BIT’s tracking says centralized exchanges hold 87.2% of the market in August. Both can be true, because the first counts specific on-chain venues and the second counts the whole market, including the giants.
Binance is the giant
Growth is concentrated. Binance handled about 55% of the volume in August. CoinDesk’s data on centralized exchanges shows Binance with a 60.9% share of $602 billion in RWA perp volume that month.
What Binance mostly offers is not stocks. Commodities make up 88.3% of its RWA derivatives activity. Gold and oil are the engine on the big centralized venues.
Hyperliquid is where it gets real
The clearest proof sits on Hyperliquid, a decentralized exchange. Since October 2025, its HIP-3 upgrade has let outside builders launch markets for stocks, indices and commodities.
- HIP-3 contracts rose from 1.8% of Hyperliquid’s trading volume in Q4 2025 to 20.7% in Q1 and 32.2% in Q2 2026.
- In one week, Hyperliquid’s RWA volume overtook its crypto volume, hitting 54% of the platform’s perpetual volume, with $26 billion of $50 billion.
- On Hyperliquid, markets tied to traditional assets now trade 85% as much as the venue’s own Bitcoin contract. Another tracker had RWA perps at 99.2% of BTC perp volume at the end of July.
- Between January and June 2026, $93.2 billion of $111.6 billion in volume (83.6%) was executed on RWA markets, per DefiLlama.
Bitcoin used to be the main attraction there. Now it is one of two.
From gold to stocks
The mix has changed. In January, commodities were 81% of RWA perp volume and stocks 9%. By August, equities reached 62.3% of volume.
Open interest, which shows how much money is still at risk in open positions, moved first. Equity open interest passed commodities in June ($1.6 billion versus $1.2 billion), and equity trading volume followed a month later. Hyperliquid’s RWA open interest reached a record $3.6 billion in July.
Reality checks
Some numbers cool the hype, and they belong in any fair telling.
It is still small next to traditional markets. Talos data showed RWA perps at roughly 7.5% of total futures volume across the market in one recent week. a16z notes that mature platforms trade futures and options worth trillions of dollars a month.
It follows Wall Street’s clock. Despite being open 24/7, weekday volume runs $30–39 billion a day, versus $3–5 billion on weekends, and weekends have been under 5% of volume since July. Traders are mirroring traditional market hours.
Liquidity is thin in places. On Hyperliquid, one interface, Trade.xyz, reportedly accounts for about 91.3% of HIP-3 liquidity. Glassnode and Fasanara also note that high volume does not by itself prove deep liquidity.
Volume can be cyclical. a16z’s tracked volume peaked at $145.1 billion in July before pulling back to $117.3 billion in August.
Why this matters
This data shows where traders go when they want exposure to stocks and commodities at any hour, with crypto as collateral. If a quarter of crypto’s perpetual volume now has nothing to do with crypto, exchanges are becoming general-purpose markets, and the next fights will be over rules, liquidity and who runs the venues. Read the headline figure with its context: crypto-asset volume was falling too, and each tracker counts differently.

Dan is a seasoned crypto writer for Blockchaindose who got his start in the space back in 2019. Over the past four years, he’s built a solid grasp of how the industry moves, focusing heavily on DeFi, NFTs, GameFi, and promising new projects.
Off the clock, you’ll usually find him buried in a good book or kicking back with a movie. His blend of hands-on market experience and straightforward commentary makes him a clear, trusted voice across the platform.