

Ask ten people whether bitcoin whales are buying or selling right now, and you’ll likely get ten different answers. Based on the on-chain record for the week ending September 16, 2026, all ten of them could be partly right.
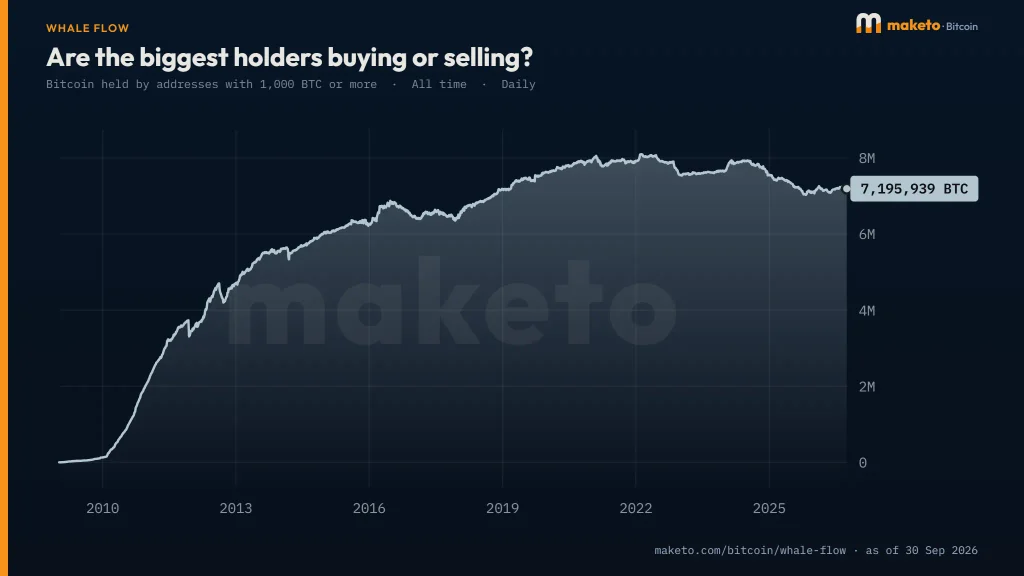
According to the most recent analysis, Bitcoin holders are splitting into two camps, mega whales adding coins, and mid sized whales letting go. Addresses holding at least 1,000 BTC collectively hold 7,192,709 BTC, or 35.8% of everything that will ever exist. But depending on which slice of that group you look at, the story flips from accumulation to distribution and back again.
The headline number, and why it’s misleading on its own
Looking only at the 30-day change, it seems like Bitcoin whales, amd other holders are leaving. The group with over 1,000 BTC sold 49,566 BTC in the last month, which is a 0.7% decrease.
If you look at a 90-day period, this same group actually bought 12,081 BTC in the last week, they added 7,513 BTC. This is just random fluctuations on top of a slow sell-off. What direction it seems to be going really depends on the timeframe you choose.
The reason the overall number is misleading is because of how it’s put together. Large individual investors, exchange wallets holding funds offline, custodians, and likely wallets connected to ETFs could be moving funds between their own wallets, and it could still count as a sale. Hence, this headline number could be misleading on its own.
Splitting the bitcoin whales in two tells a sharper story
Breaking down the large holders into two groups gives a clearer picture. In the 30 days preceding this report, the 89 addresses holding 10000 BTC or more added 47,880 BTC. One new address also reached this size category during that time.
In contrast, the 1,901 addresses holding between 1,000 and 10,000 BTC, often called “sharks,” sold off 97,446 BTC over the same 30 days. There were also 44 fewer addresses in this category compared to a month prior.
If you combine these two figures (+47,880 – 97,446), you get the reported 30-day change for the entire 1,000+ BTC group: -49,566 BTC. The math works out, showing the data is consistent internally, even if interpreting it isn’t simple.
What does this difference actually mean? There are two likely explanations, and they could both be happening at the same time.
- First, there might be genuinely different behavior. Large institutions and entities handling custody are buying more, while individual large holders are selling to take profits or reduce their risk.
- Second, it could be a simpler explanation. Coins are moving up to the larger category. Balances might be crossing the 10,000 BTC mark and moving from the “shark” group to the “mega-whale” group. This would increase the count in the larger category without representing any new buying activity on the market.
What outside data adds to the picture
Data on addresses holding Bitcoin is not in itself fulfilling. When you merge it with other reports, it adds detail, but still shows that the results depend on the method used.
Take for instance Glassnode’s own analysis from September 16. This report indicates that from June 30 to around the end of the summer, addresses holding between 1,000 and 10,000 BTC sold about 50,500 BTC. In the same period, the much larger group of addresses holding over 100,000 BTC bought around 59,100 BTC.
Glassnode pointed out that this top group includes exchanges, custodians, and ETF providers. Therefore, the increase doesn’t necessarily mean individual wealthy investors were buying more.
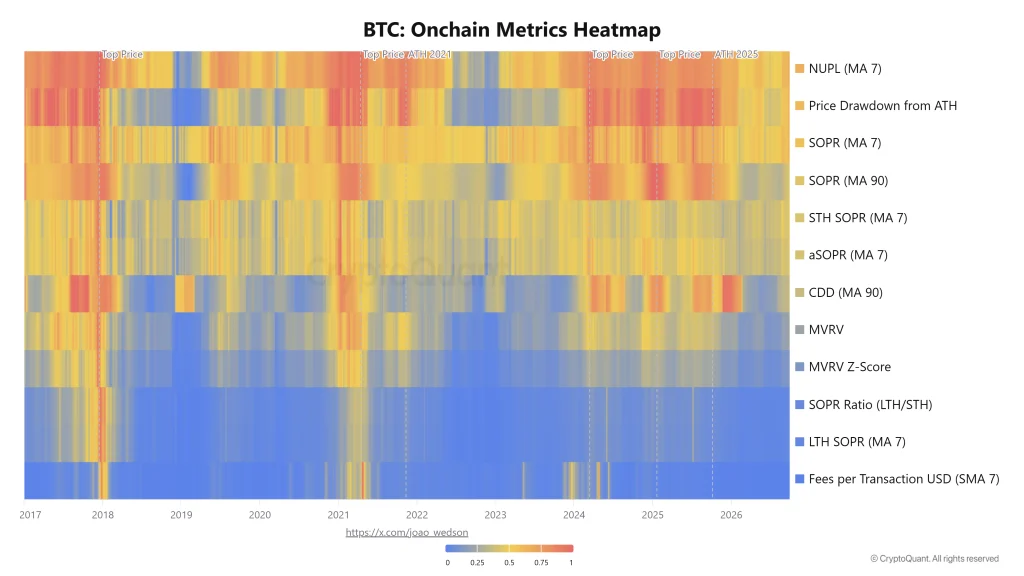
Another analytics network CryptoRank, while using data from CryptoQuant, offers a similar but not exact picture.
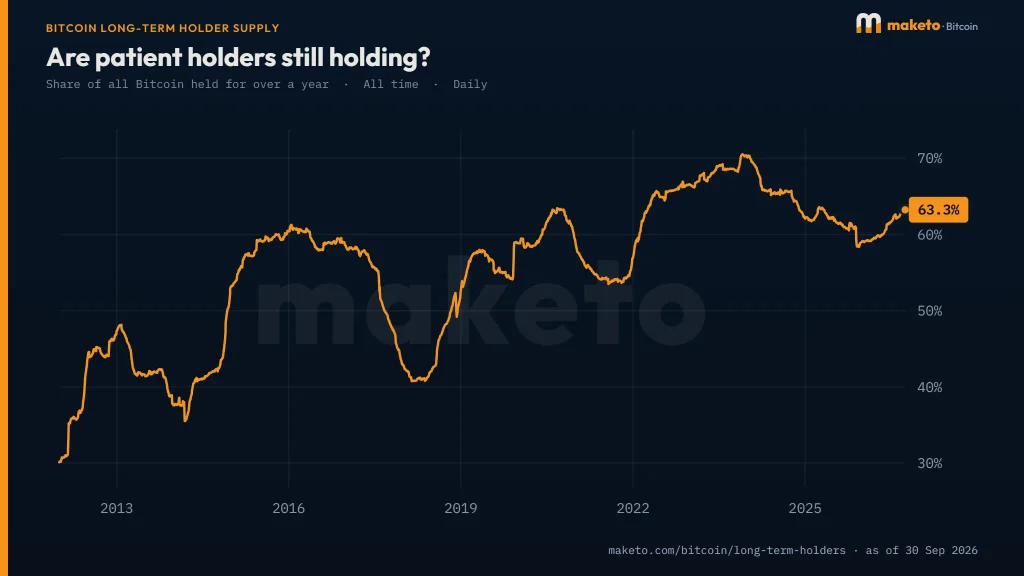
The 60 day period between June 1 and August 30th 2026 showed that wallets with 100-1,000 BTC added about 73,300 BTC. Additionally, wallets with over 10,000 BTC added roughly 43,300 BTC.
Reports that came earlier from CryptoRank in August, suggested that wallets holding more that 100 BTC accumulated about 54,400 BTC between mid-June and mid-August. Wallets holding over 10,000 BTC increased by 46,420 BTC on a rolling 60-day basis. This was the fastest pace for that group all year, according to the report.
Overall, these external reports generally agree with the new data: large addresses, likely tied to custodians, were buying during the summer rally, while mid-sized “whale” wallets were either less active or selling.
However, the exact numbers don’t match up perfectly. Trackers like Glassnode and CryptoQuant often group individual addresses into larger “entities” using certain rules. On the other hand, data from services like Maketo’s, similar to most basic blockchain explorers, count each address individually. An exchange that uses a thousand separate cold storage wallets might appear as a thousand “whales” in an address count, but as just one large “entity” in a grouped analysis.
The ETF wildcard, and why demand looks like it’s cooling
Data about ETFs, crypto fast moving stories could also partially explain why large addresses have been buying a lot of Bitcoin recently.
Coinpaper data shows that U.S. spot Bitcoin ETFs saw their best month in August, bringing in about $3.52 billion in net inflows while Bitcoin’s price increased by around 25%. The inflow pushed the total net assets of ETFs up by about 31% in just one month, nearing the $100 billion mark.
In a separate analysis, Glassnode estimated that about $2.23 billion was put into spot ETFs in August. These inflows likely went directly to the addresses holding over 10,000 BTC, since large ETF providers often keep client assets in a few very large cold storage wallets.
And September?
After displaying 27 days of steady growth, the amount of money flowing into crypto networks started to slow down around September 16th, according to Glassnode. In the same period U.S. spot bitcoin ETFs saw more money leaving than coming in.
About $334 million pulled out between September 8th and 14th. BlackRock’s IBIT was responsible for most of the outflows seen in early September. Glassnode summed it up by saying buyers had gotten quiet, even though the amount of bitcoin held on exchanges continued to decrease.
This situation, where ETF buying slowed down, exchange balances kept dropping, but mid-sized investors seemed to be selling, suggests that the big buying surge from August might be over. What we’re seeing in September looks more like people tidying up their holdings rather than new money coming in with strong confidence.
So, are these big investors buying or selling?
Both are happening, depending on the size of investors. The most consistent trend across all the data we looked at is that the very largest accounts, those holding over 10,000 BTC have been buying up bitcoin for most of the summer through mid-September. The accounts holding between 1,000 and 10,000 BTC have been the clearest net sellers during the same period.
What we can’t know from looking at wallet balances is the reason behind these movements. Someone moving nearly 100,000 BTC could be:
- Taking profits after a good run
- Moving assets to a custodian for a business deal
- Consolidating several smaller wallets into one larger one that now exceeds the 10,000 BTC threshold.
It might be tempting to dismiss this information about large wallet movements as just trivia for crypto enthusiasts, but it actually has practical implications.
The behavior of these large accounts has historically been a fairly reliable indicator of bitcoin’s price trend over the medium term. This is because these wallets control a significant portion of the available bitcoin. When these holders buy more (accumulation), it can make price increases even bigger when demand is rising. When they sell (distribution), it can add selling pressure even if smaller investors are still buying.
For anyone trying to use this information don’t rely on just one metric or a short time frame by itself. It’s important to compare wallet data with analysis that groups addresses by owner, like Glassnode’s, keep an eye on ETF flows to see institutional activity, and treat any single number as a piece of information rather than a definitive conclusion.
As the numbers from this past week show, whether you conclude “whales are buying” or “whales are selling” can completely depend on which specific group of addresses you are looking at.

Dan is a seasoned crypto writer for Blockchaindose who got his start in the space back in 2019. Over the past four years, he’s built a solid grasp of how the industry moves, focusing heavily on DeFi, NFTs, GameFi, and promising new projects.
Off the clock, you’ll usually find him buried in a good book or kicking back with a movie. His blend of hands-on market experience and straightforward commentary makes him a clear, trusted voice across the platform.