
If you follow NFT news, you have seen these two numbers side by side: Blur at 58%, OpenSea at 31%. They usually appear as a scoreboard of which marketplace is “more fake.”
They aren’t a scoreboard, because they don’t measure the same thing.
Both come from a 2024 study by researchers at the University of Pennsylvania and Boston University. Their direct on-chain method flagged 40.86% of trades on Blur and 31.22% of trades on OpenSea as wash trades. So 31% is a share of trades. The share of value is a different figure. By value, the study puts wash trading at 58.16% on Blur and 26.39% on OpenSea.
Wash trading means buying and selling an asset to yourself, or to a partner, to fake demand. Here is how the same data looks once the two measures are separated:
| Marketplace | Share of trades flagged | Share of value flagged |
| Blur | 40.86% | 58.16% |
| OpenSea | 31.22% | 26.39% |
| LooksRare | 40.66% | 95.68% |
Blur’s pattern is the telling one. About four in ten trades were flagged, but nearly six in ten dollars were. That means the suspicious trades were bigger than the normal ones. On OpenSea the opposite holds: the flagged trades were slightly smaller than average, so they made up less of the money.
The overall conclusion of the study is stark. Roughly 38% of trades and about 60% of traded value likely involved manipulation, with a wide range across exchanges. That range runs from 25% to 95% of value.
Why rewards, not marketplaces, drive the fakery
The worst offender is not Blur or OpenSea. It is LooksRare, where wash trades made up a massive 95% of trade volume.
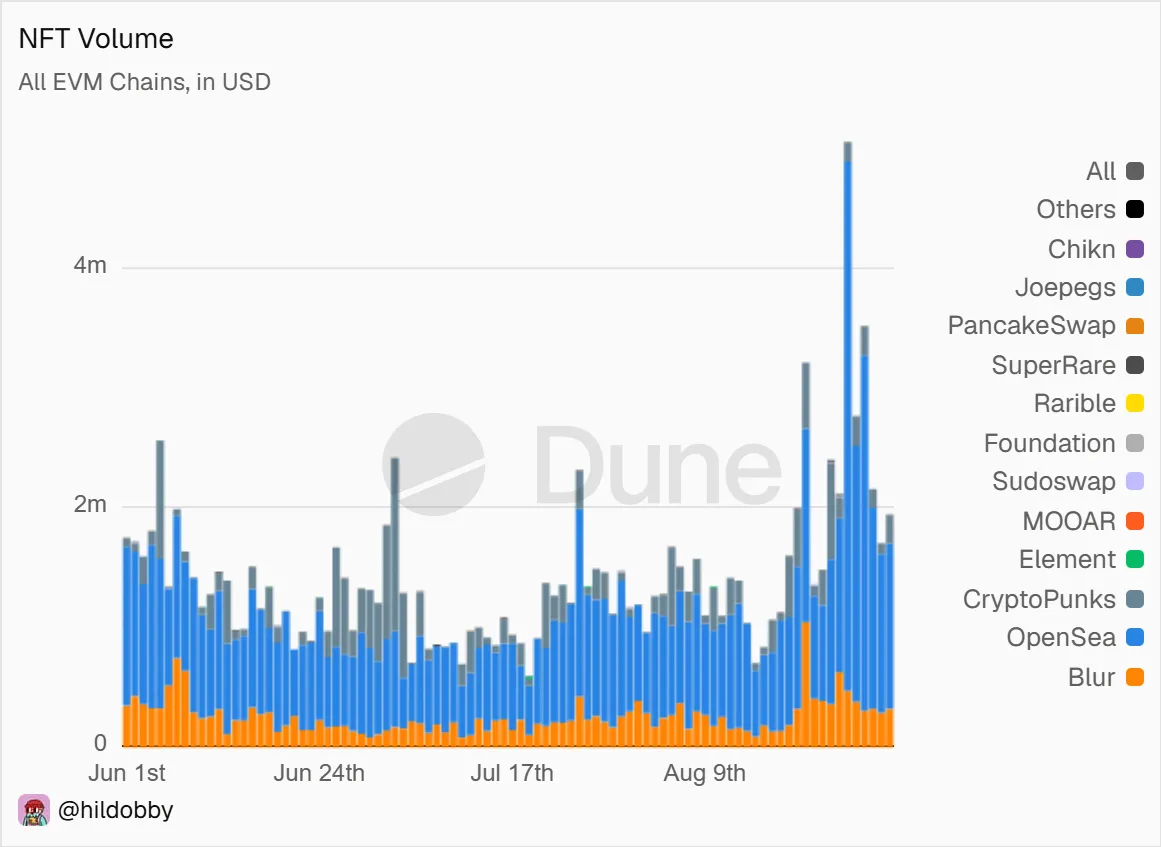
The researchers point to the reason. Platforms like LooksRare and Blur grew in part by paying rewards tied to trading volume. When the rewards beat the transaction costs, wash trading becomes profitable.
A separate graph-based study agrees on the pattern. Markets with incentives showed higher wash-trading volume than those without. LooksRare reached 94.5% and X2Y2 reached 84.2%.
If you pay people to trade, they will trade with themselves.
Even the “right” number depends on who is counting
Anyone quoting a single percentage should know that estimates vary a lot by method.
- The 2024 Penn/BU study, using four on-chain filters, found the 26% to 31% OpenSea figures above.
- An earlier academic paper, “NFT Bubbles,” estimated OpenSea wash volume at roughly 2% and only 0.67% of transactions. It looked at OpenSea data only and used a different approach.
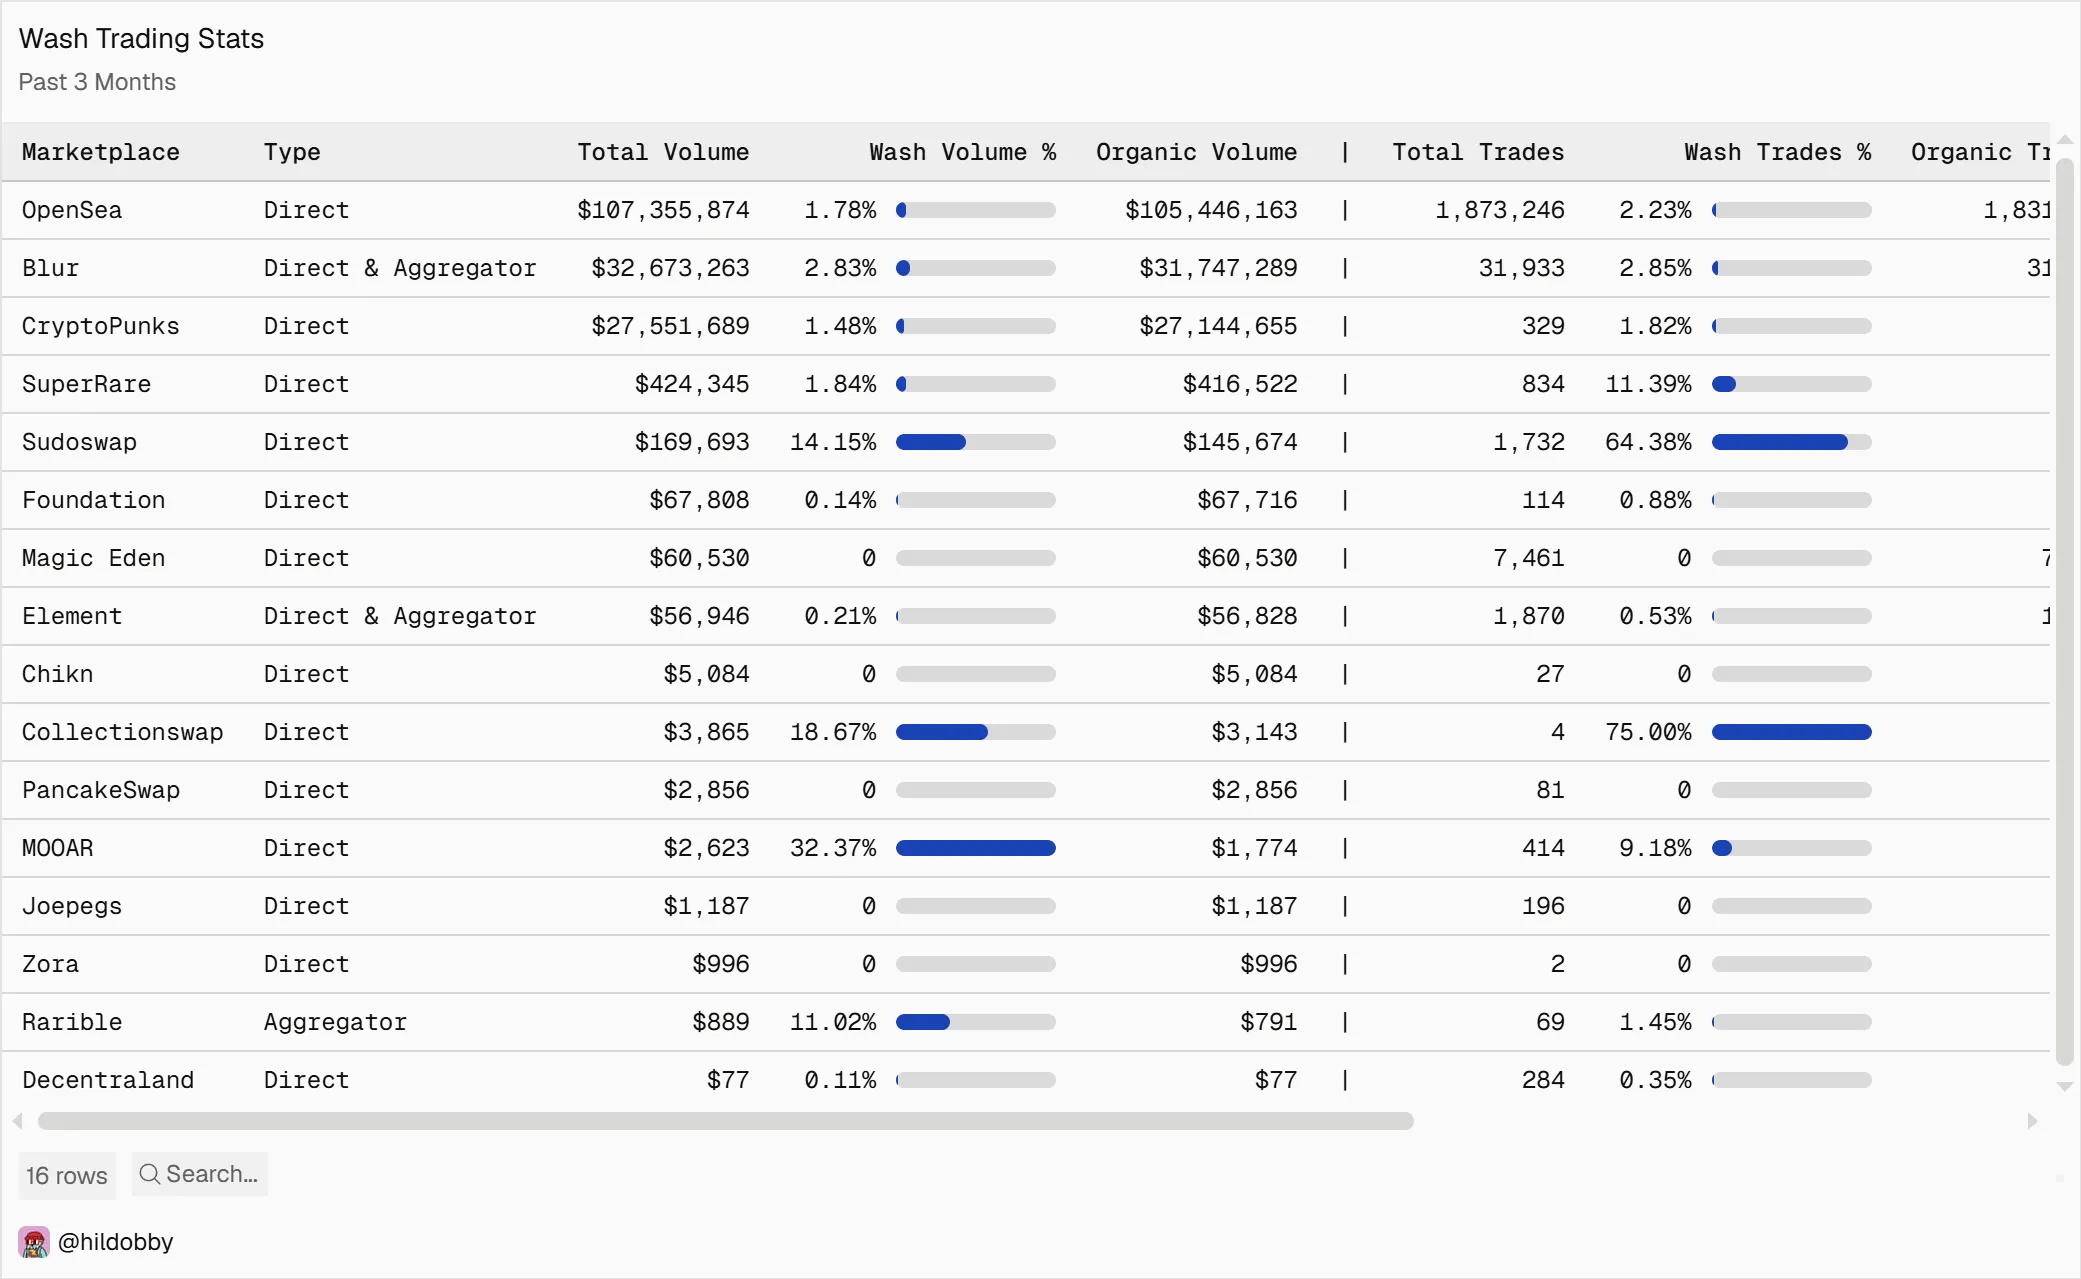
- Dune Analytics research by the pseudonymous analyst hildobby looked at Ethereum as a whole. It found wash trading made up 58% of NFT volume in 2022, peaking above 80% in January, with more than $30 billion linked to it over all time.
So “Blur 58%” is accurate, but only as a share of value, from one study, using data that stops in early 2024. Quoting it as today’s fact goes further than the data does.
Enter Base
Now the second half of the story. While Ethereum marketplaces were debating fake volume, a newer chain started climbing the charts.
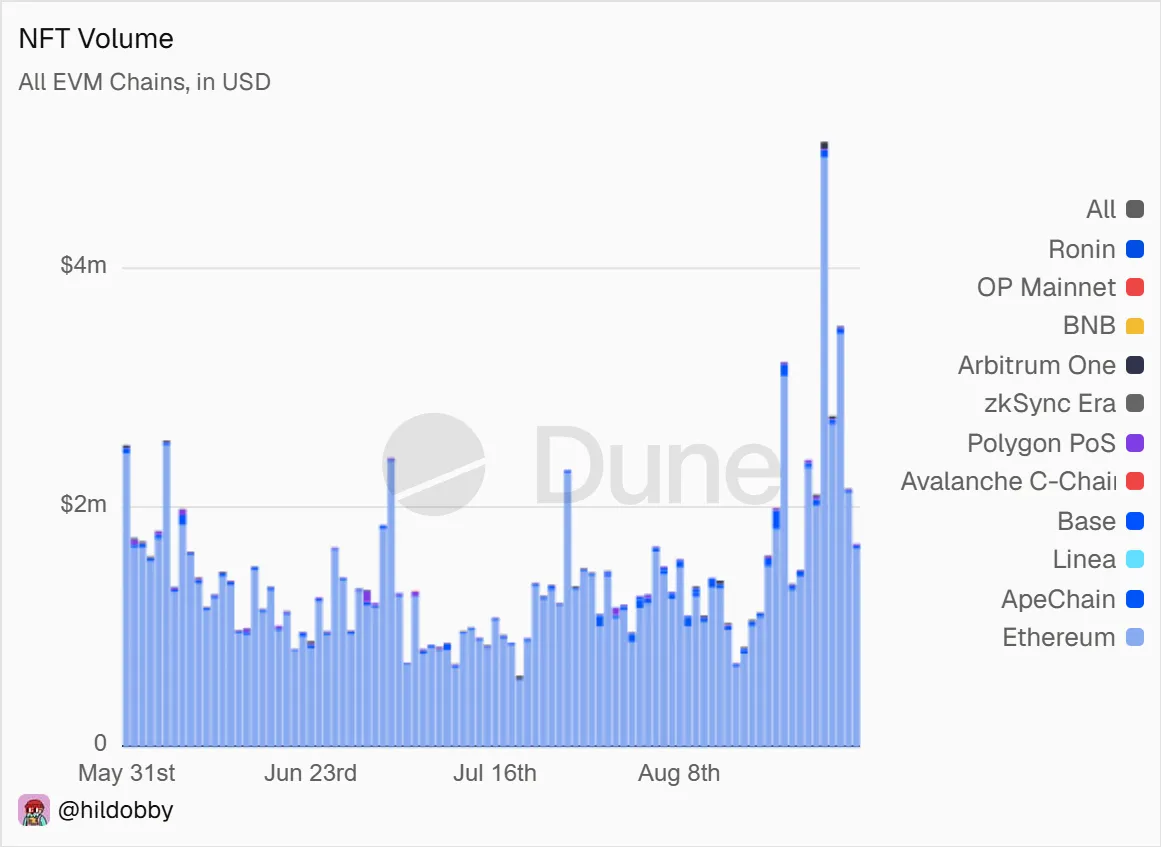
In October 2025, the NFT market rose 30% to $546 million, with 10.1 million sales. Base overtook Solana and Polygon with $88 million, while Ethereum stayed on top at $263 million. The numbers come from DappRadar.
Put simply, Base had about 16% of that month’s NFT volume and Ethereum had about 48%.
The market looks very different from 2021. The average NFT price fell from about $321 in January 2025 to $54 in October, and the 10.1 million sales were the highest count of the year. The money is also a fraction of the peak, which was a $3.5 billion month in 2022. That makes it a market of many cheap trades, not a few expensive ones.
The trend runs across the quarter too. Q3 2025 NFT volume nearly doubled to $1.58 billion, and sales hit a quarterly record of 18.1 million. There is also a cost story behind it. Layer 2 fees dropped by more than 90% after Ethereum’s scaling upgrade, which made small purchases economical on chains like Base.
So is Base “organic”?
This is where the original thesis needs care. The honest answer is that the data leans toward organic but does not prove it.
The case for organic:
- Many cheap trades by many people looks nothing like a few wallets looping expensive assets. October had 820,945 active NFT traders.
- Big wash-trading blowups, like LooksRare, came from huge, high-value loops. That isn’t what Base’s numbers look like.
The case for caution:
- DappRadar credits Base’s October jump partly to low costs and marketplace features that reward repeat buyers. Rewards are exactly the ingredient that fueled wash trading elsewhere.
- Sales and users have not grown in step. Between Q1 and Q2 2025, sales rose 158% while wallets rose only 28.6%. DappRadar reads that as conviction from existing users. It could also mean the same wallets are trading more, which is the pattern incentive farming produces.
- I found no published wash-trading estimate for Base itself. The Penn/BU study covers LooksRare, Blur and OpenSea only, so any claim that Base is “clean” is inference.
Volume is the number most people use to judge whether an NFT market is healthy. If 26% to 58% of it can be fake, then a surge on any chain tells you little until someone checks how it was made. The next time you see a record month, ask two questions: is the number counting trades or dollars, and is anyone being paid to trade? Those answers matter more than the headline.

Dan is a seasoned crypto writer for Blockchaindose who got his start in the space back in 2019. Over the past four years, he’s built a solid grasp of how the industry moves, focusing heavily on DeFi, NFTs, GameFi, and promising new projects.
Off the clock, you’ll usually find him buried in a good book or kicking back with a movie. His blend of hands-on market experience and straightforward commentary makes him a clear, trusted voice across the platform.