In mid-September, XRP seemed stuck. It dropped from around $1.42 on September 14 to about $1.28-$1.30 by September 16, based on Coinranking’s futures data. By September 25, XRP was trading near $1.57. That’s a jump of about 22.7% from its lowest point. As of September 30, it’s around $1.49. Its market value is close to $94.3 billion, and daily trading volume is about $3.74 billion, according to CoinGecko.
A CryptoQuant analyst pointed out that this movement shows “heating” signs on the Spot Volume Bubble Map. This tool tracks XRP trading volume and how fast it’s changing. The analyst described this as a warm-up phase that often happens before an “overheating” signal, which has previously appeared before big price surges.
This is a strong statement, so we looked at the data.
What the bubble map actually shows
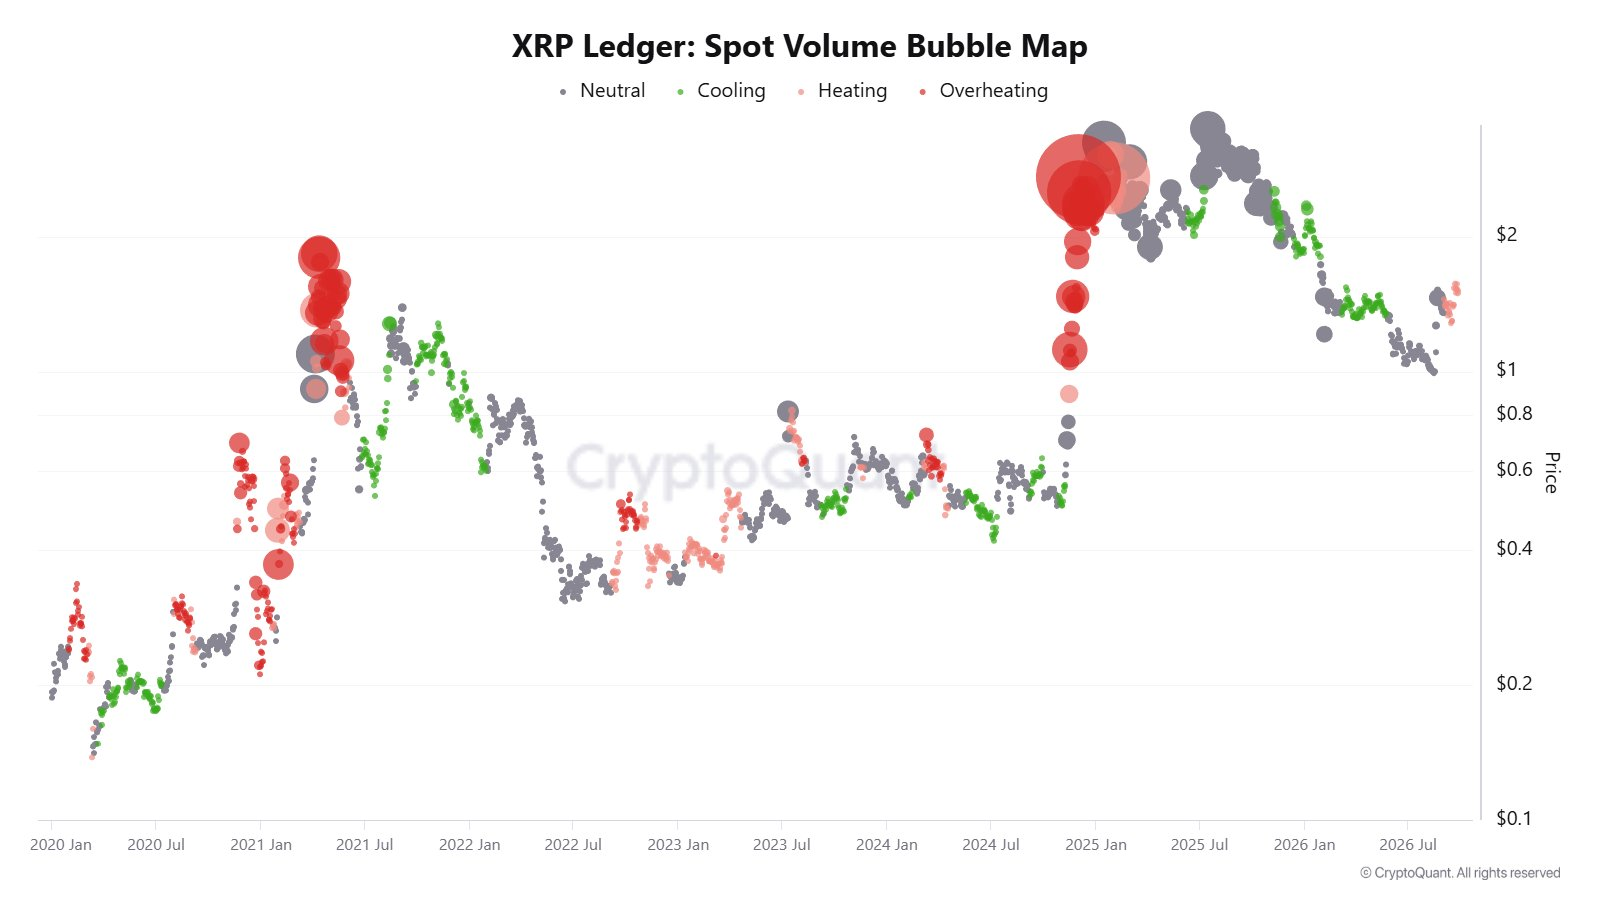
The Spot Volume Bubble Map is straightforward. Larger bubbles indicate higher trading volume. The colors show if the volume is increasing or decreasing. When volume drops, the map shows a “cooling” market. When it goes up, the map shows it’s warming.
So, a warm reading means more people are trading XRP, and they’re doing it more quickly. This is informative, but it doesn’t predict future prices. The map doesn’t tell us if the increased volume is from buying or selling, nor if it’s driven by genuine demand or by traders using borrowed money. The idea that a warm-up leads to an explosive rally is a pattern the analyst observed, not a proven rule. There haven’t been any backtests published to show how reliably this pattern works.
So, the first thing to understand is that the signal itself is real, but the prediction that comes with it hasn’t been proven.
Claim one: XRP has moved off its bottom
Verdict: Supported.
The rebound is real, and it came with heavy futures activity:
| Date | XRP close | Futures volume | Open interest | Funding rate |
| Sep 16 | $1.30 | $4.75B | $2.02B | -0.0020% |
| Sep 18 | $1.40 | $5.06B | $2.13B | 0.012% |
| Sep 21 | $1.54 | $6.95B | $2.58B | 0.012% |
| Sep 22 | $1.57 | $7.26B | $2.72B | 0.012% |
| Sep 25 | $1.57 | $6.00B | $2.24B | 0.012% |
Futures volume rose about 53% from the low to the September 22 peak. Open interest, the total value of bets still open, rose about 35% over the same stretch. And funding, the fee traders pay to hold bullish or bearish positions, flipped from slightly negative to steadily positive. In plain terms, traders who had been leaning bearish switched to leaning bullish.
But the rally has already cooled a little. XRP is up about 15.2% over 14 days, yet down 7.7% over the last seven. That is a bounce with bumps, not a straight line.
Claim two: The futures market is heating up
Verdict: Supported, with a warning.
CoinGecko reports about $4.99 billion in perpetual futures open interest, roughly 5.29% of XRP’s market cap. Perpetual futures volume is around 6.6 times spot volume. In other words, for every $1 of XRP changing hands on the spot market, about $6.60 is being traded in futures.
That is a lot of leverage. It can push a rally further, but it can also turn a small dip into a wave of forced selling, called liquidations.
There is a healthier way to read the sequence, though. On Binance, XRP open interest fell about 32%, from $323 million on August 22 to $219 million on September 17. That looks like traders being flushed out during the sell-off. Later, open interest climbed to nearly $600 million, a nine-month high. A rebound that starts after leverage has been cleared is generally sturdier than one that starts on top of it.
Claim three: Whales are buying
Verdict: Supported, but the picture is mixed.
On-chain trackers point to large holders adding about 1.54 billion XRP over 96 hours, worth roughly $2.2 billion. Another report counted 470 million XRP, about $724 million, over five days. That looks bullish.
But whale balances can rise for dull reasons, like moving coins between wallets or reshuffling custody, so they are not always real buying.
Exchange data add a complication. Large-wallet deposits to Binance hit about 1.6 billion XRP over 30 days, the highest since March. Binance’s XRP reserves reached about 2.623 billion, a 69-day high. Coins sent to exchanges can be sold.
Yet the same reporting shows Binance saw roughly 21.7 million XRP flow in per day, while about 11.6 million flowed out. Reserves grew only 0.22%. That looks more like heavy turnover than a clear dump.
Claim four: An explosive rally is coming
Verdict: Not established.
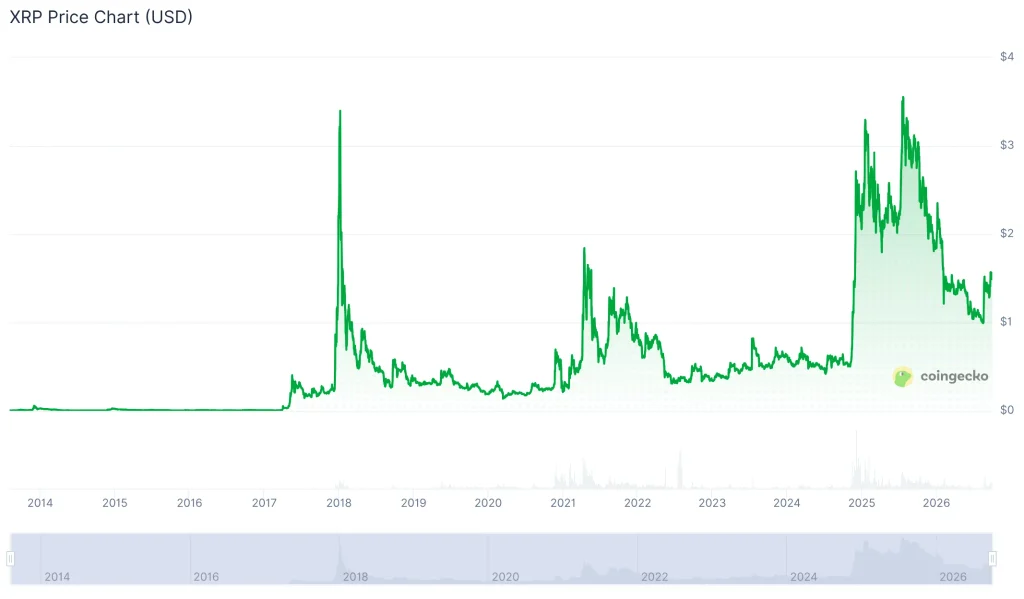
This is where the story runs ahead of the evidence. At $1.49, XRP is still about 59% below its July 2025 high near $3.65. That tells you XRP has room to grow. It does not tell you the low is in. An asset can sit far below its peak and still make new lows.
XRP’s history cuts both ways. It has staged huge rallies, including the run to roughly 3.65-3.84 around 2017-2018. It also spent years in a bear market afterward, and in 2021 it recovered toward 1.80-1.97 without reclaiming its old high. Big bounces do not guarantee new records.
The biggest near-term risk is the leverage. If XRP fails to hold the 1.45-1.50 area, crowded long positions could unwind fast. The 7-day range of about 1.45 – 1.64 shows where the fight is happening.
What would make the bullish case stronger
Keep it simple. The bulls need five things:
- Price holds 1.57-1.64 and then makes higher lows.
- Spot volume rises with price, showing real buyers, not just futures traders.
- Open interest grows steadily, with funding staying neutral or mildly positive.
- Exchange reserves stay flat or fall while whales keep accumulating.
- XRP beats Bitcoin and other altcoins, rather than just riding the market.
If most of these show up, the “heating” story gets much stronger. If price stalls while funding climbs, the same data becomes a warning.
Why this data matters
Volume and positioning data tell you who is in the market and how much risk they are taking, which price alone cannot. In XRP’s case, they say the rebound is real and interest is rising, but leverage is high and a bottom is not confirmed. Knowing that helps you tell a healthy recovery from a crowded trade. This is analysis, not financial advice.

Dan is a seasoned crypto writer for Blockchaindose who got his start in the space back in 2019. Over the past four years, he’s built a solid grasp of how the industry moves, focusing heavily on DeFi, NFTs, GameFi, and promising new projects.
Off the clock, you’ll usually find him buried in a good book or kicking back with a movie. His blend of hands-on market experience and straightforward commentary makes him a clear, trusted voice across the platform.