
Are Bitcoin holders in profit or loss? Well, the answer could be different depending on who you ask. The truth is, a number known mostly to analysts is 56% paper gain. It’s the all-holder MVRV reading of 1.56× on September 28, 2026.
Buried lower on the same page is the “typical coin,” a second figure that gets far less attention. Instead of weighing every coin by its dollar value, this measure takes the coin in the exact middle of the pack, where half of all coins cost their owners more and half cost less. That coin is up 31%, not 56%.
The gap exists because the big number is tilted by a few giant, very early wallets that bought Bitcoin for pennies. The 31% figure reads the crowd instead of the whales, and it shows a smaller cushion than the headline suggests.
First, what is MVRV?
MVRV is a way to compare Bitcoin’s current price to the average price when each coin was last bought or sold. If the MVRV is 1.0, it means the average holder is breaking even. An MVRV of 1.2 means they’re up 20%, and 0.9 means they’re down 10%.
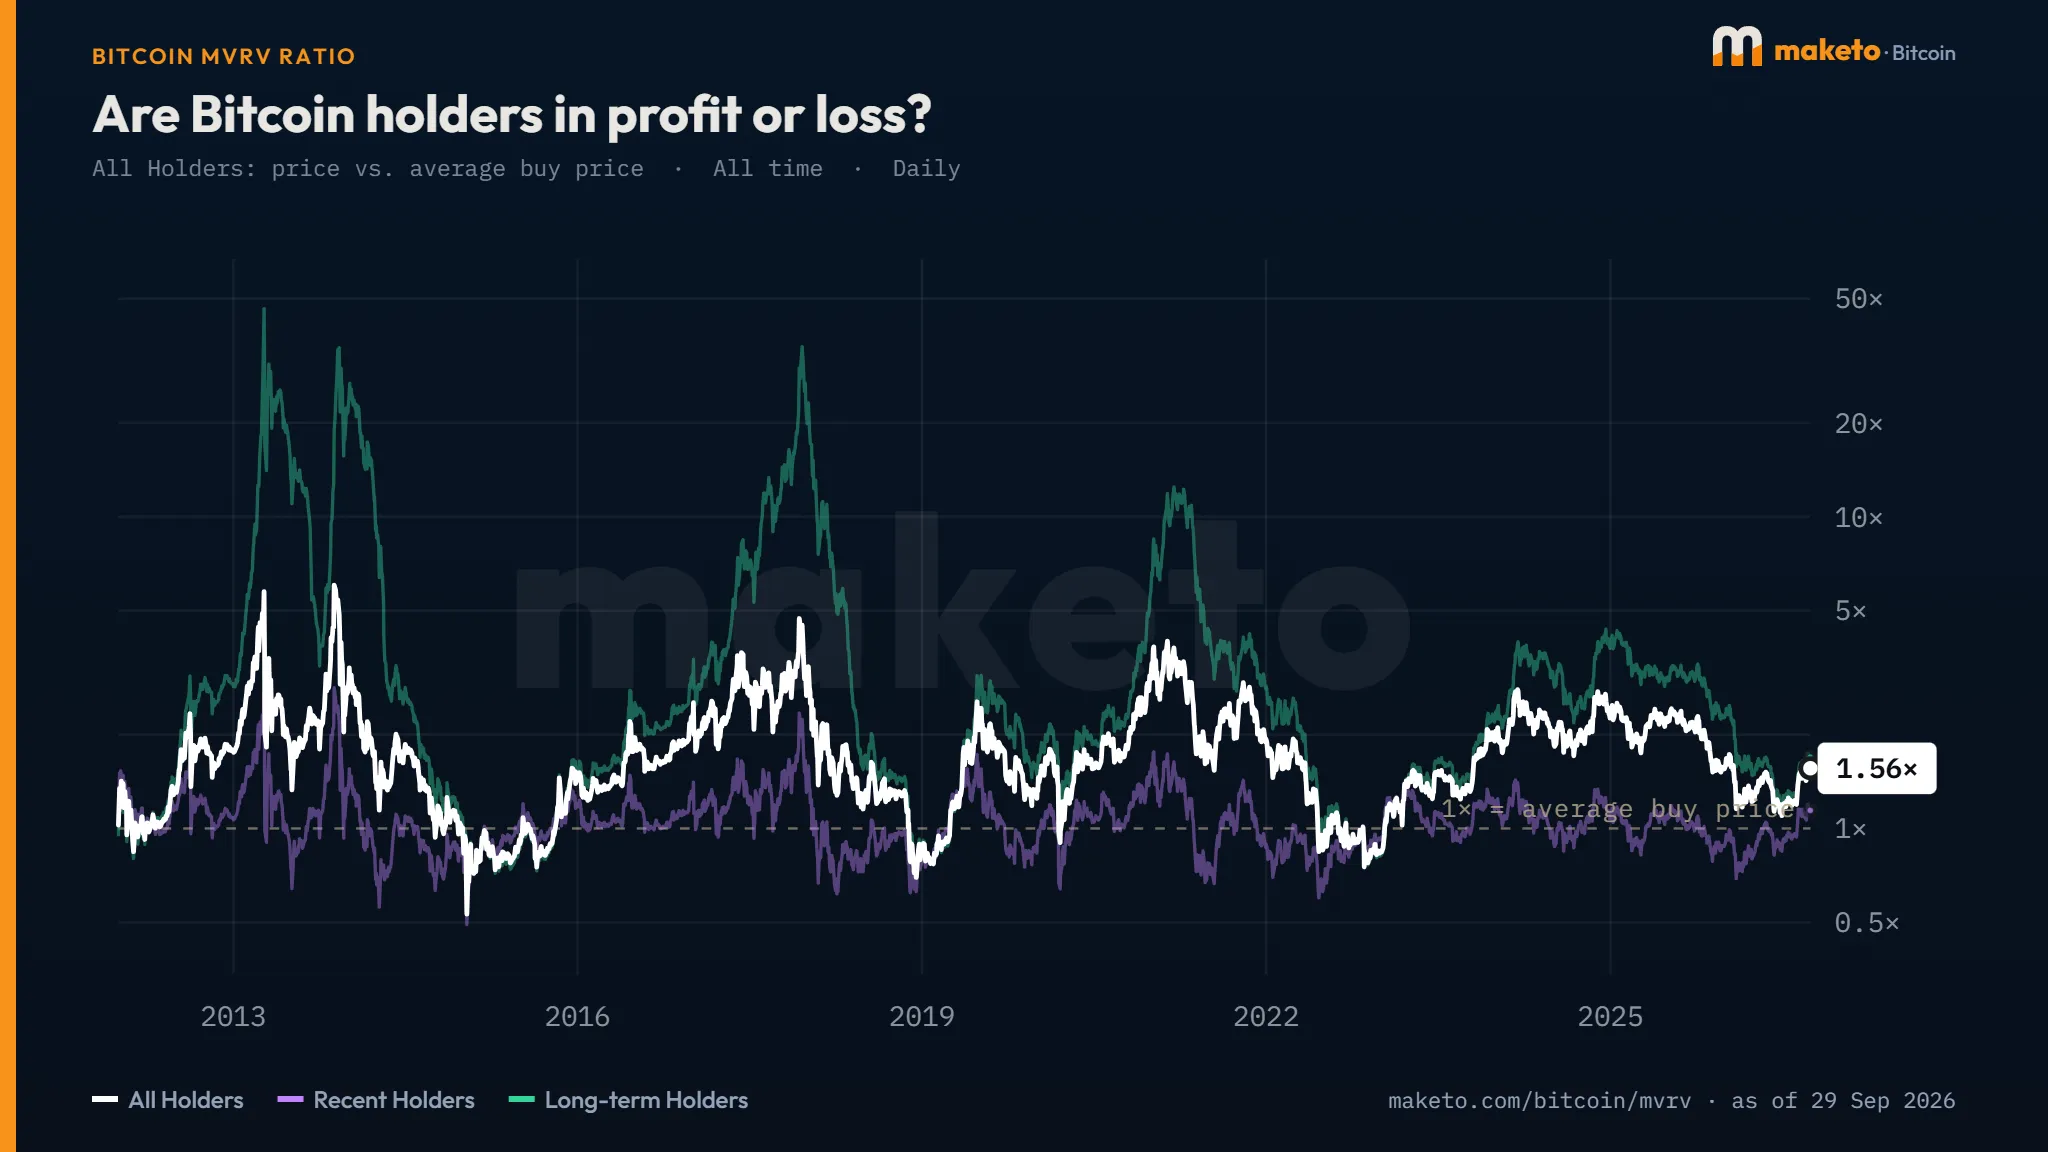
Here’s how different groups are doing right now:
- All holders are up about 56%.
- Long-term holders are up about 68%.
- Recent holders are up about 14%.
- The average coin is up about 31%.
So, most people who hold Bitcoin are making money. What’s interesting is to see who feels comfortable and who doesn’t.
The share of coins in Bitcoin profit
More than 73% of Bitcoin is currently trading above its purchase price, meaning about a quarter of coins are at a loss. This is up from about 69% a week ago. Back in early August, only about 52% of Bitcoin was in profit, and it even dipped below 50% in June and July. The low point in June was similar to the one in November 2022.
Currently, the market is near a level that analysts pay attention to. Historically, when the percentage of Bitcoin in profit goes above 74.7%, it often signals a shift from a bear market to a bull market. The market is right around that point now.
The recent-buyer squeeze
The chart showing recent holders is important. These are coins that last changed hands within the last five months. For ten months in a row, from October 2025 to July 2026, the MVRV for this group was below 1.0.
It hit a low of about 0.766 in February 2026, meaning these newer buyers were down around 23%. It wasn’t until August 2026 that this group got back above breaking even, and today’s MVRV of 1.14 is only a small buffer. This buffer isn’t very large in dollar terms either; a drop of about 12% would put recent holders back in the red.
The long-term holder comedown
Long-term holders are still profitable, but their gains have decreased significantly. A year ago, their MVRV was 3.03 (a 203% gain), but now it’s 1.68. The overall MVRV for all holders has dropped from 2.08 to 1.56 in the same period.
Their average gain is now around 72%, compared to about 350% in December 2024. While they are still making money, they are less likely to sell now compared to when the market peaked previously.
ETF buyers: right at the line
People who bought Bitcoin through US spot ETFs have been fluctuating around the breakeven point all year. Their average purchase price was estimated around $89,600 in November 2025.
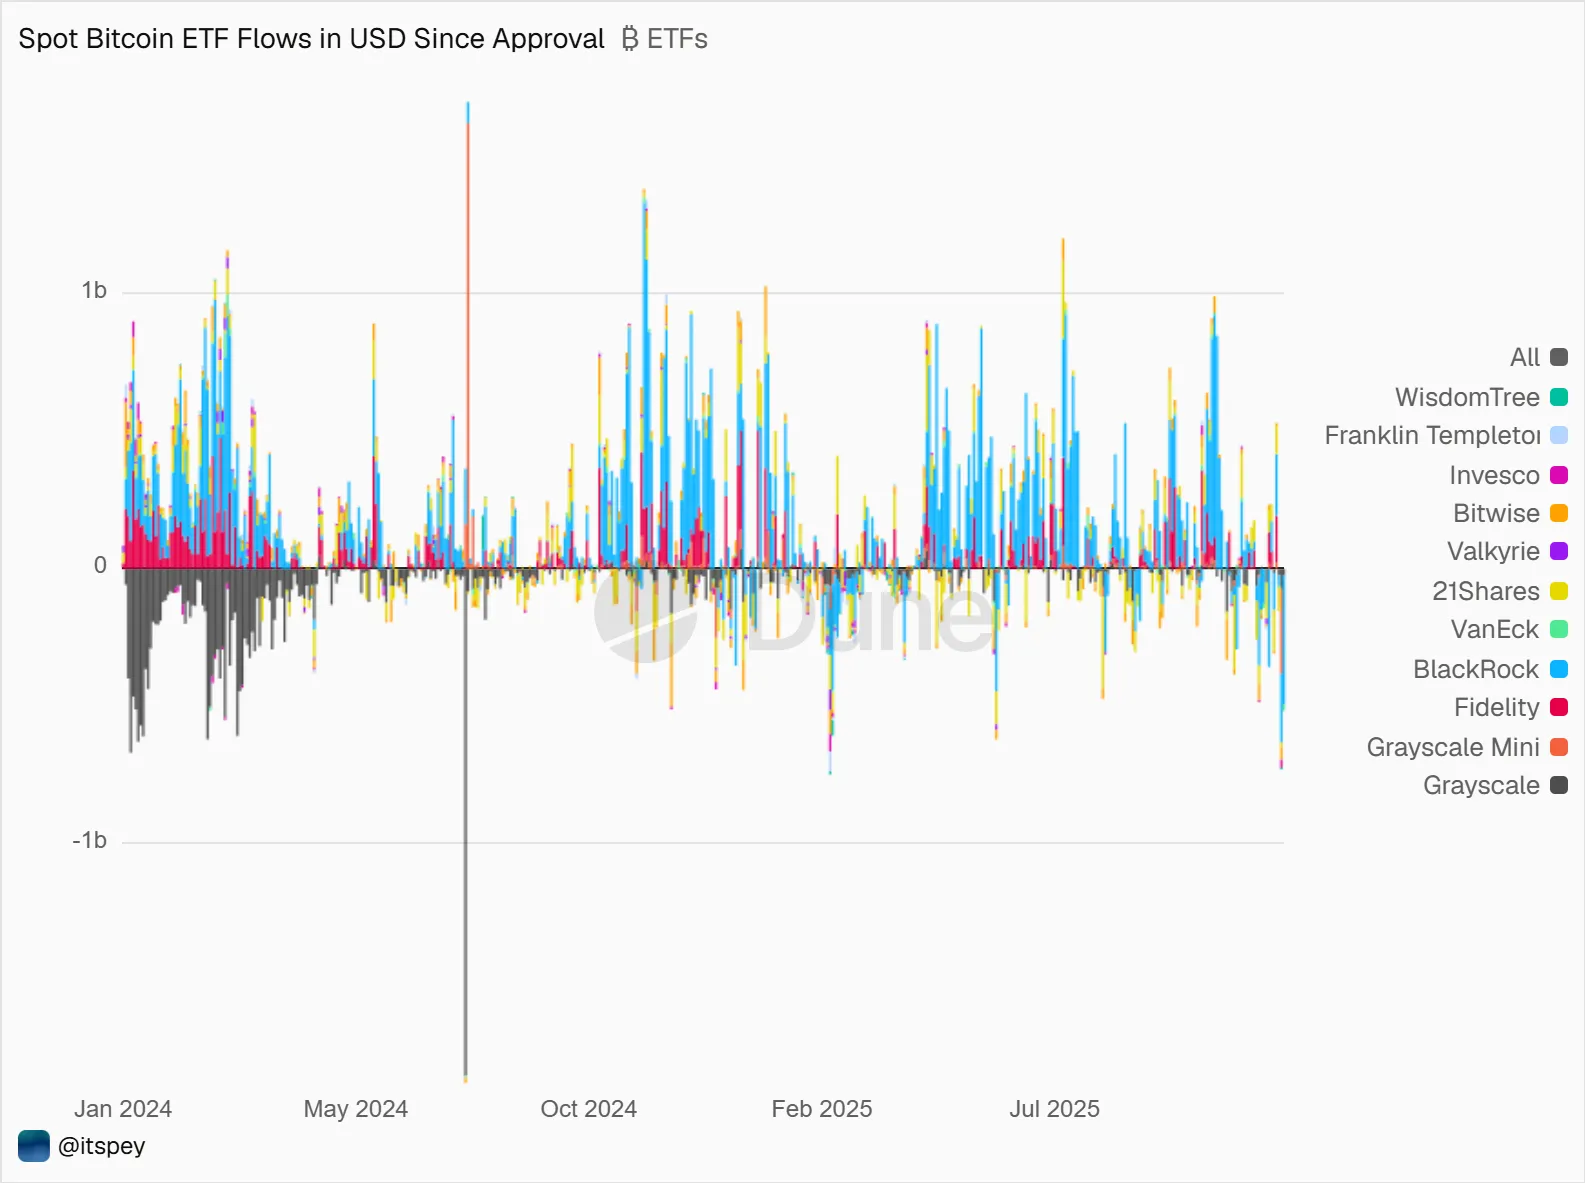
When Bitcoin dropped below that price, ETF investors started losing money. By February 2026, the average cost was about $87,830, while Bitcoin was trading near a nine-month low of around $74,600.
Then the tide turned. Roughly $4.6 billion flowed into the funds after August 19, and Bloomberg’s James Seyffart estimated the average cost basis at about $81,722, which put the typical ETF holder back in profit for the first time since January. But it was fragile.
On September 23, Bitcoin dipped below $85,000 and closed 1.9% under an $86,000 cost-basis estimate from Bitfinex. Different analysts land on slightly different averages, so treat any single figure as a rough guide. With Bitcoin near $84,000, ETF holders are, in effect, standing on the line.
What the losers look like
The underwater group isn’t “most holders.” It’s concentrated among people who bought high. Glassnode’s age data from September 18 showed coins last moved 6 to 12 months ago at 0.898× (about 10% below cost) and coins moved 1 to 2 years ago at 0.844× (about 16% below cost). Older coins, those held 3 to 5 years sat at 2.58×.
Those cohort figures come from a different method than the headline MVRV readings, so they shouldn’t be treated as one series. But they point the same way. Losses live in the coins bought near the 2025 highs, not in the coins that have been sitting for years.
Is anyone cashing out?
Glassnode says profit-taking is well below the levels of the 2024 and 2025 tops, and it noted that nearly all short-term holders are back in profit. Its realized profit-to-loss ratio has risen to 1.4, meaning realized profits are about 1.4 times realized losses.
Coins from long-term holders are clustered around $84,000 to $85,000, with the next major resistance near $96,700.
Why this matters
Knowing whether holders are in profit or loss tells you where the selling pressure could come from. People at a loss tend to sell when price climbs back to their entry point. People with big gains sell when they feel rich. People with thin gains can be shaken out by a modest dip.
Right now the market has comfortable long-term holders, nervous recent buyers, and a group of higher-cost coins still waiting to get out. That mix helps explain why the price keeps stalling in the mid-$80,000s.

Dan is a seasoned crypto writer for Blockchaindose who got his start in the space back in 2019. Over the past four years, he’s built a solid grasp of how the industry moves, focusing heavily on DeFi, NFTs, GameFi, and promising new projects.
Off the clock, you’ll usually find him buried in a good book or kicking back with a movie. His blend of hands-on market experience and straightforward commentary makes him a clear, trusted voice across the platform.