

On paper, U.S. crypto ETFs look like a broad, healthy market. Dozens of funds, more than a dozen issuers, and exposure to Bitcoin, Ether, Solana, XRP and more. “Record ETF demand” is now a standard headline.
But it matters less how many funds exist than where the money sits. In nearly every category, one fund holds most of it.
The stat hiding in plain sight
Here is the concentration by asset, using the tracker snapshot behind this piece:
| Asset | Dominant ETF | Share of that asset’s ETF money | AUM |
| Bitcoin | IBIT (BlackRock) | 63% | $63.52B |
| Ethereum | ETHA (BlackRock) | 52% | $7.04B |
| Solana | BSOL (Bitwise) | 69% | $992M |
| XRP | Bitwise XRP ETF | 36% | $514M |
| Chainlink | GLNK (Grayscale) | 72% | $135M |
| Hedera | HBR (Canary) | 100% | $55M |
Even XRP, the least concentrated asset here, has a leader holding more than a third of the money. In the smallest markets, the “market” is a single fund.
Bitcoin: a market built around one product
Bitcoin is where the story matters most, because it holds roughly 86% of all U.S. crypto ETF money.
Other tracking confirms the pattern. In mid-October 2026, U.S. spot Bitcoin ETFs held roughly $105 billion to $107 billion, with IBIT’s share around 62%. That fits the 63% figure above.
The top three funds are even more dominant. IBIT, Fidelity’s FBTC and Grayscale’s GBTC hold roughly $66.2 billion, $14.3 billion and $10.2 billion respectively, about 87% of all Bitcoin ETF assets. A separate March 2026 analysis put the top three issuers’ share at roughly 94% of total spot Bitcoin ETF assets. The exact number shifts with the tracker and the date. The direction doesn’t.
The Bitcoin held inside IBIT is also enormous. The fund holds 814,715 BTC, about 4% of Bitcoin’s 21 million supply cap.
Concentration isn’t new, but it keeps tightening
IBIT’s share has not stayed fixed. In the early days, it was a split market. Data from Dune showed IBIT holding half of the 12 products’ total assets, with Fidelity and Grayscale at 17.5% each. By mid-2025, IBIT accounted for approximately 56% of all U.S. spot Bitcoin ETF holdings.
Different trackers produce different shares. One April 2026 snapshot had IBIT at about 45% of $86 billion. Another March 2026 comparison put it at roughly 77%. Definitions, dates and whether a tracker counts cash all move the number. Even so, almost every tally now has IBIT as the largest fund by a wide margin.
Ethereum tells a similar story. In June 2025, ETHA held about 41% of the U.S. Ethereum ETF market, with Grayscale’s ETHE at 29.5%. By the snapshot above, ETHA is at 52%. As Grayscale’s older fund bled assets, the leader’s share grew.
The flows are even more lopsided than the assets
Assets show where money has settled. Flows show where new money goes, and that is more concentrated still.
IBIT has gathered more than $65 billion in cumulative net inflows since launch. A tracker summary in August 2026 went further. IBIT’s inflows were more than the entire category’s total, because the other ten funds are net negative combined.
Bad markets make this clearer. In 2026, Bitcoin has had a rough year. CoinDesk reported that IBIT and Fidelity’s FBTC captured over 90% of daily inflows in early 2026 despite falling prices. Another analysis noted that IBIT alone took in about $2.7 billion in 2026 net inflows during a losing year, and that the rest of the field was deeply negative without it.
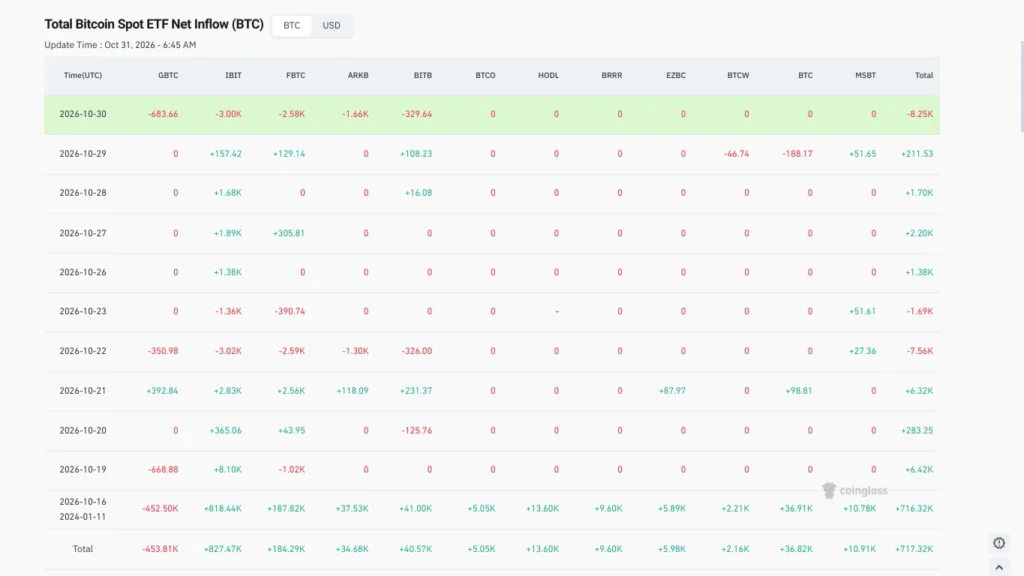
A single day shows how much one fund can matter. On October 19, 2026, IBIT recorded a $665.2 million inflow, more than the other Bitcoin ETFs combined.
Beyond Bitcoin: the issuer layer
The concentration also shows up by issuer. One weekly tracker put iShares and Grayscale at 57.08% and 16.96% of the crypto ETF market share. That’s about 74% between two brands.
In Ethereum, one issuer’s fund can move the whole category’s numbers. In one weekly report, ETHA’s redemptions of $246 million were the largest of any fund, far more than the next fund’s $51 million. In March 2026, the headline Ethereum ETF inflow figure was driven almost entirely by one new fund’s launch, the iShares Staked Ethereum Trust ETF. Without it, the category was in net outflows.
When one issuer launches or redeems, the “market” number moves.
The custody layer
There is a second concentration beneath the funds. A 2026 analysis estimated that about $74 billion, or roughly 80.8% of all ETF-held BTC, sat with a single custody counterparty. That counterparty is Coinbase. Fidelity’s FBTC stands out as an exception, as it uses its own Fidelity Digital Assets for custody.
So the apparent diversity of 43 ETFs hides two choke points: a handful of funds on top, and one custodian below.
Is the U.S. market really that big?
The U.S. looks small next to the global wrapper market. ETF Llama counts 378 crypto ETFs and ETPs worldwide, with $131.13 billion in AUM across 34 providers and 89 tracked cryptos. The U.S. spot universe is a narrower slice of that, and a more concentrated one. CoinDesk’s March data put U.S.-listed products at 84.5% of the global crypto ETF total. Different data sets define the global total differently, so treat the exact split with care.
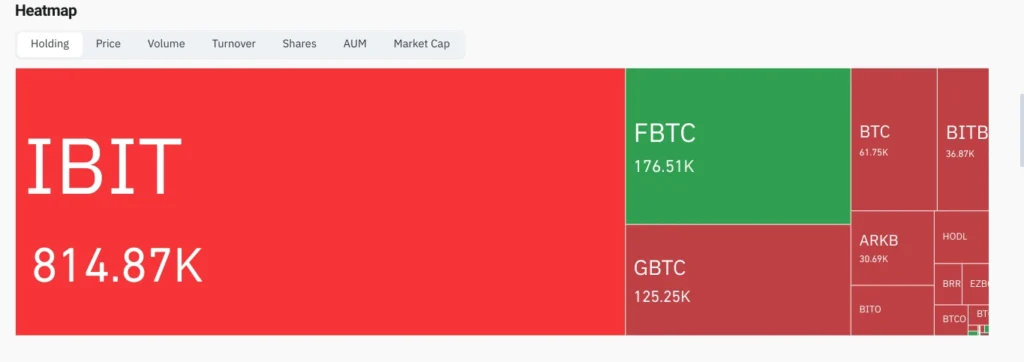
One caveat for data users: methodology differs between trackers. Maketo values the coins funds report at daily closing prices, so its AUM can differ slightly from issuers’ own NAV figures. CoinGlass is useful for intraday flow refreshes, but its dashboard was returning placeholder values when we checked.
Why it matters
“Crypto ETF demand” is often read as broad institutional adoption. For Bitcoin and Ether, it is largely a BlackRock story. A single issuer’s creation and redemption decisions can move headline flow numbers more than the behavior of thousands of separate investors. Before reading a flow chart as a sentiment signal, ask which fund it’s really measuring.

Dan is a seasoned crypto writer for Blockchaindose who got his start in the space back in 2019. Over the past four years, he’s built a solid grasp of how the industry moves, focusing heavily on DeFi, NFTs, GameFi, and promising new projects.
Off the clock, you’ll usually find him buried in a good book or kicking back with a movie. His blend of hands-on market experience and straightforward commentary makes him a clear, trusted voice across the platform.