


Bitcoin supply is 21 million coins, but the supply that decides a crypto crash is a few million dollars’ worth of orders sitting near the price.
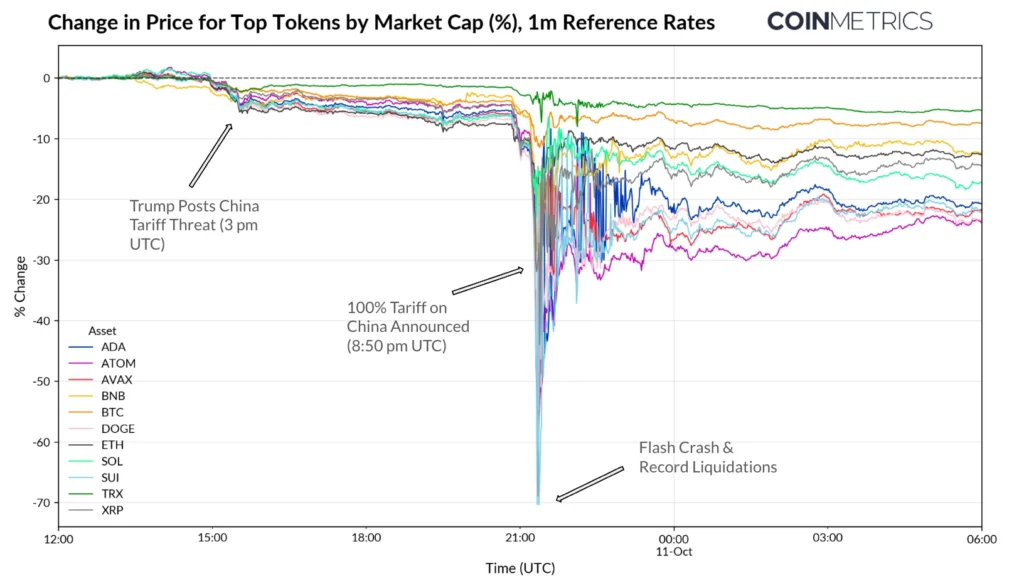
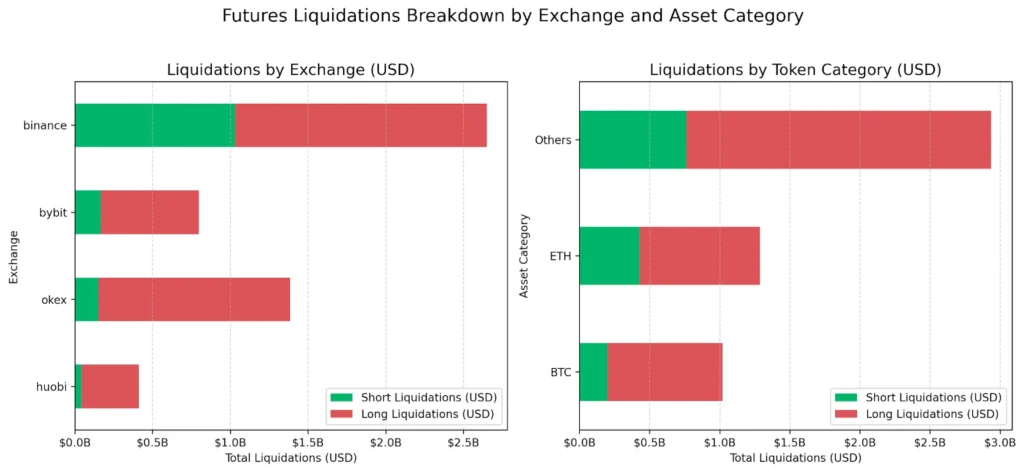
On Friday, October 10, 2025, the crypto market went through what was probably its worst forced unwind on record. Most headlines focused on the over $19 billion in leveraged positions that closed within 24 hours, roughly nine times any previous single-day liquidation event. That total may even understate it. One analysis described the figure as a lower bound, because exchanges limit how many liquidation events they report each second.
The more useful number is one most traders never look at: how much buying interest was actually waiting underneath the price when the selling began.
What an order book is
When you buy bitcoin on an exchange, you are matched with someone selling. Buy orders waiting at lower prices are “bids,” and sell orders waiting at higher prices are “asks.” Together they form the order book.
“Order-book imbalance” compares the two sides. If bids dominate, buyers outnumber sellers. If asks dominate, sellers do. A thin book means there is little of either, so even a modest order can move the price.
Why liquidations make thin books worse
A liquidation is a forced sale. When a leveraged trader’s collateral runs low, the exchange closes the position automatically with a market order, which accepts whatever price is available.
Each forced sale eats into the bids. That pushes the price lower, which pushes the next group of leveraged traders past their limits, and their positions close too. The loop feeds itself, and the thinner the book at the start, the faster it runs.
What happened on October 10
Researchers who looked at the order books afterward found the bids had largely disappeared. Kaiko reported that on several exchanges there was almost nothing near the mid-price, and meaningful bids only showed up much further out, at 4% and 10% below. The books thinned out to the point of appearing empty for several minutes across major BTC venues.
Amberdata measured depth within 10 basis points (0.1%) of the price. It found that depth fell 46% in 48 hours, from $48 million to $26 million, as market makers pulled their orders. It also noted that depth levels at every distance fell roughly in proportion, so the liquidity went away across the whole book.
Bitcoin itself fell more than 14% across the October 10–11 window. Altcoins fared far worse. Coinbase’s review said many altcoins dropped 40% to 70%, with market makers pulling quotes.
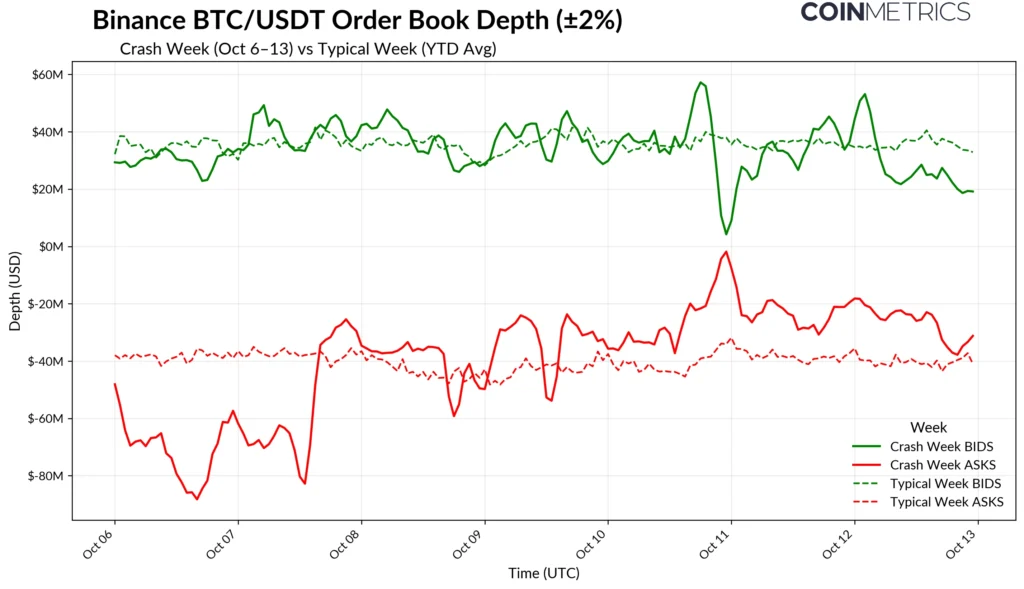
Coin Metrics looked at Binance’s BTCUSDT book within 2% of the mid-price and found it thinned dramatically during the crash, so modest selling pressure produced outsized swings.
Where Bitcoin supply fits in
Bitcoin supply is usually discussed in terms of scarcity: the 21 million cap, and how much of it long-term holders keep off the market. Glassnode data from an earlier flush in September 2021 shows why that framing misses something. A liquidation of about 30% of open perpetual positions, around $4 billion, drove a $10,000 drop within an hour. Over the same period, long-term holders owned 79.5% of the supply.
So most coins were locked away and barely moved. The price still fell sharply, because the coins that could actually be sold were few, and the buyers waiting to absorb them were fewer. Total supply tells you little about a crash. What matters is the tradable supply meeting the displayed demand at that moment.
Does the data hold up?
Partly, and the claim needs some limits.
What supports it. The depth drop was measured independently by Kaiko, Amberdata and Coin Metrics, and the three sources describe the same pattern. The damage also lasted. Six months later, Kaiko data showed BTC depth at 1% had fallen from about $8 million before the crash to roughly $3 million at the trough, and recovered only to about $6 million. That figure comes from a secondary summary of Kaiko’s data, so check it against the original report before publishing.
What complicates it. Thin books were not the only cause:
- Coinbase also blamed fragmented altcoin liquidity and automatic unwinding by decentralised protocols.
- Collateral problems on one venue made things worse. Binance reimbursed roughly $283 million after USDe, BNSOL and wBETH briefly lost their pegs.
- Coin Metrics summed it up as a macro shock that lit the match, liquidation mechanics that threw gasoline on it, and thin books that turned it into a firestorm.
What it can’t do. Order-book imbalance is not a reliable alarm for any single crash. The research behind this article, a 2026 study of seven major BTC cascades from 2022 to 2025, found that aggressive one-sided order flow showed up as a pattern across the group. Individual events did not consistently stand out from normal conditions, and the warning signs differed by crash type. A thin book raises the risk of a cascade, but it does not tell you when one will start.
Why this matters
Most traders watch price, open interest and liquidation maps. Almost none watch depth, which is the thing that decides whether a leveraged flush becomes a 3% dip or a 14% drop. Liquidation maps are also estimates, built from assumed leverage and not from actual orders.
A large liquidation cluster sitting above thin bids is a fragile spot, while the same cluster above deep, stable bids is much less dangerous. Depth data costs little to track and is one of the few warning signs you can still check before a flush, because by the time the liquidation headlines arrive, the bids are already gone.

Dan is a seasoned crypto writer for Blockchaindose who got his start in the space back in 2019. Over the past four years, he’s built a solid grasp of how the industry moves, focusing heavily on DeFi, NFTs, GameFi, and promising new projects.
Off the clock, you’ll usually find him buried in a good book or kicking back with a movie. His blend of hands-on market experience and straightforward commentary makes him a clear, trusted voice across the platform.