Crypto’s favorite number tells you what already happened. A quieter one tells you what a trade would do to the price.
Almost exactly a year ago, on Oct. 10, 2025, crypto had its biggest liquidation day on record. About $19 billion in positions were wiped out. Exchanges were still posting enormous trading volume. A BeInCrypto analysis found that perpetual futures volume stayed high while executable depth collapsed by more than 98%.
Both things were true at once, and that is the point of this story. Volume said the market was busy. Depth said you couldn’t sell anything without wrecking the price.
The number everyone quotes
Open any price tracker and the first thing you see is 24-hour volume. It looks like a measure of how easy a coin is to trade, but it only counts trades that have already happened. It says nothing about whether the same trade could happen again right now.
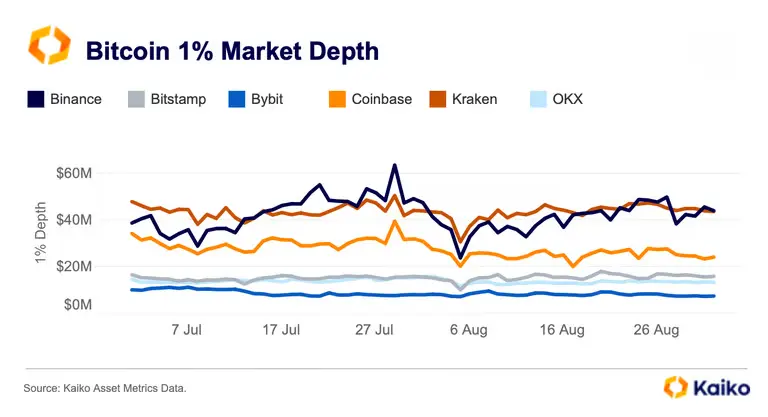
Depth does. Take the orders resting in the book within 1% of the current price, on both the buy and sell side, and add up their dollar value. That is roughly how much you can trade before the price moves 1%. Kaiko, the market-data firm, has used this measure for years. Its first Bitcoin report in 2016 defined available liquidity as the amount of bitcoin one can theoretically trade without moving the price more than 1%, measured as market depth at ±1% of the mid-price. Its price index at the time gave 70% of the weight to liquidity and 30% to volume.
The simplest way to see the difference is a stress question. Not “did this token do $500 million in volume?” but “can a $5 million market order be absorbed without a 1% move?”
How much of the volume is real?
For years, the answer was “less than you think.”
In 2019, asset manager Bitwise told the SEC that about 95% of reported Bitcoin trading volume was fake. The firm looked at order-book data from 81 exchanges and found that only ten reported real volume. Where CoinMarketCap showed about $6 billion in average daily volume, Bitwise counted only $273 million as legitimate.
Academic work points the same way. A 2021 study tested 29 exchanges for statistical signs of fake trades. On the unregulated ones, wash trading averaged over 70% of reported volume. The same paper found that these fabricated volumes helped exchanges climb the rankings.
Wash trading means one party sits on both sides of a trade. Volume goes up, but nobody’s position changes.
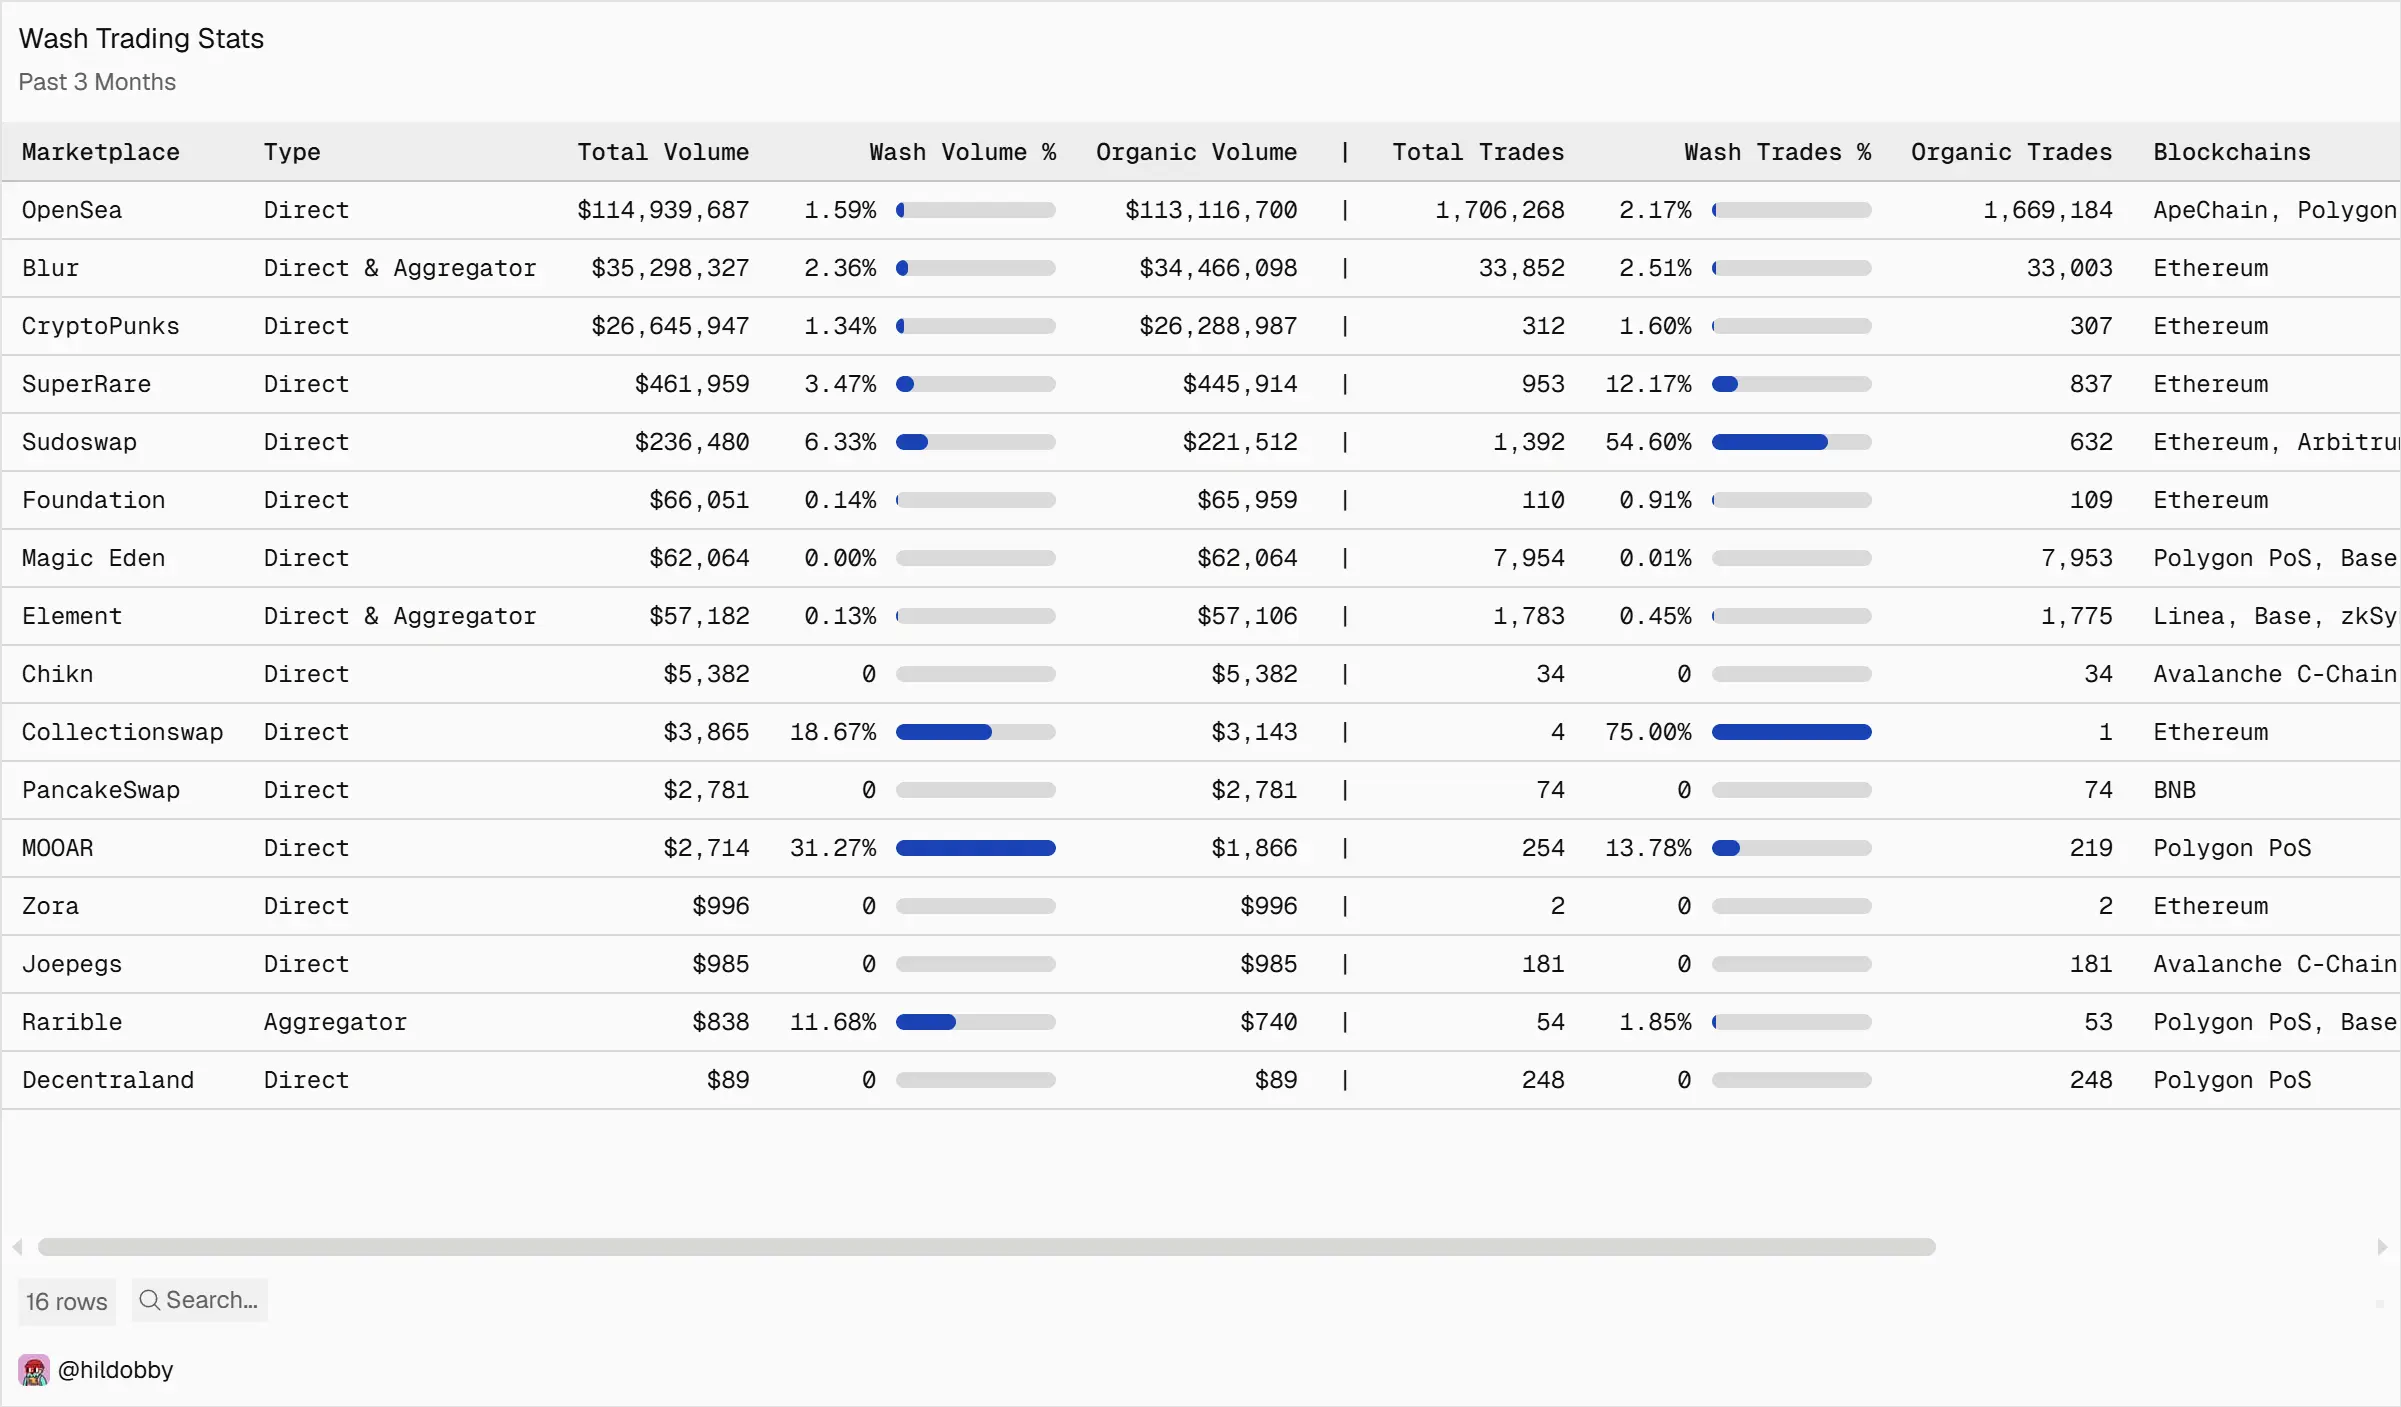
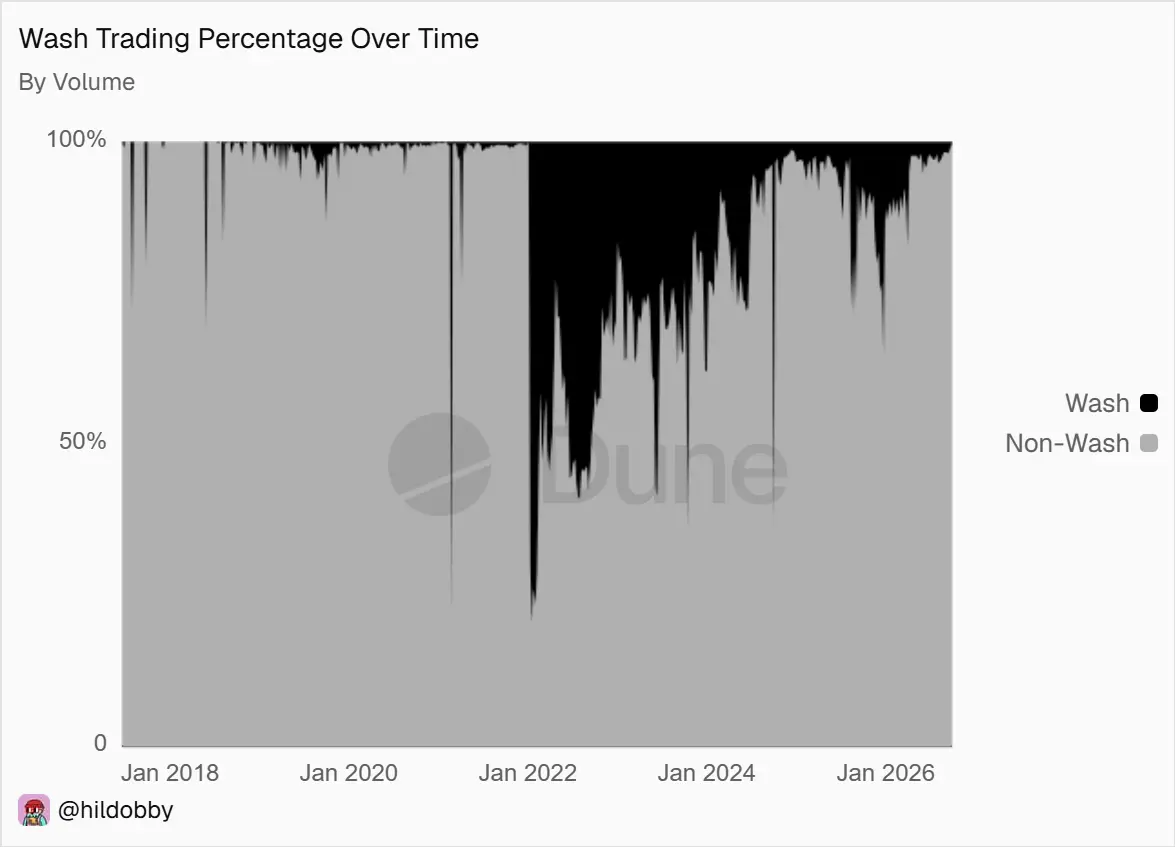
On-chain data shows the same pattern in NFTs, where anyone can check. Researcher hildobby built wash-trade filters on Dune. They found that 44.5% of cumulative NFT trading volume, about $30 billion, appeared to be wash trades. In 2022 it was 58% of the year’s volume, peaking above 80% in January.
The share depended heavily on the venue. LooksRare was over 98% wash trading and X2Y2 was 87%, while OpenSea was only 2.3%. The two worst venues paid token rewards for trading, which gave people a reason to trade with themselves.
That is the case against volume: it can be manufactured cheaply, and sites rank exchanges by it.
Why depth is harder to fake
Fake volume costs almost nothing. Fake depth means leaving real orders in the book where someone can hit them, which is expensive and risky.
So the mismatch between the two is a useful warning. Kaiko’s documentation says that if volume far exceeds order-book depth, reported volume may not reflect real demand, which hints at possible wash trading. A Cointelegraph guide gives an example: a pair with $50,000 of depth at the 5% level but $2 million in daily volume looks suspicious.
You can turn this into a simple ratio: 24-hour volume divided by average ±1% depth. A high ratio is a flag, not proof.
The October test
October 2025 showed what the ratio hides: depth can vanish even on honest, well-known venues.
Kaiko’s post-crash analysis said that on several exchanges there was almost nothing near the mid-price. Only wider bands, such as 4% and 10%, showed meaningful bids. Books looked empty for minutes at a time.
One Binance pair shows how extreme it got. Cointelegraph Research found that trading volume surged by a factor of 896 as ask-side depth collapsed by 99%. Amberdata saw a related pattern for the market as a whole. Depth at 10 basis points fell 46% in 48 hours, from $48 million to $26 million, and it started falling while prices were still high. In other words, depth gave an early warning.
The damage lasted. Six months later, Kaiko data showed Bitcoin’s 1% depth had fallen from about $8 million before the crash to about $3 million at the low, then recovered to roughly $6 million. Kaiko also reported that aggregated 2% depth on Bitcoin was down roughly 30% from its 2025 high.
Glassnode found something similar in January 2026. Bitcoin and altcoin spot volumes had dropped to their lowest since November 2023 even as prices climbed. Prices were rising, but there was little behind the move.
Where depth falls short
Depth is not a magic number, and three caveats apply.
Old volume claims are old. The 95% figure is from 2019, and the 70% figure comes from a 2021 paper. Volume is not worthless today. Many regulated venues look healthy, and in the Dune data some marketplaces had almost no wash trading. Blur, for example, got about 11% of its volume from wash trades, which came from only 1.56% of trades.
Depth can be gamed too. The 2% band is the most widely displayed because aggregators publish it, and your own source material notes that Kaiko has moved away from emphasizing it for that reason. Compliance firm Elliptic lists large “walls” that appear near the top of the book and vanish before anyone trades against them as a manipulation pattern. A snapshot of depth is not proof of anything. Look at it over time.
Numbers are not comparable across sources. Depth changes with the band (0.1%, 1%, 2%), the exchange and the pair, and published figures vary a lot. Compare a source with itself over time, not against another source.
Why it matters
If you trade size, run a fund or list tokens, volume can mislead you right when it matters. Depth shows how much price damage your order would cause, and a thin book plus a sell-off is what turns a bad day into a crash. Tools are making it easier to check, too: Glassnode added spot order-book metrics for Binance and Coinbase in 2026, covering depth at chosen price bands and the estimated price impact of a market order.

Dan is a seasoned crypto writer for Blockchaindose who got his start in the space back in 2019. Over the past four years, he’s built a solid grasp of how the industry moves, focusing heavily on DeFi, NFTs, GameFi, and promising new projects.
Off the clock, you’ll usually find him buried in a good book or kicking back with a movie. His blend of hands-on market experience and straightforward commentary makes him a clear, trusted voice across the platform.