A study on NFT wash trading detection from the University of Pennsylvania, Boston University and the University of California, Los Angeles classifies about 38% of trades on LooksRare, Blur and OpenSea as likely manipulation. Brett Hemenway Falk, Gerry Tsoukalas and Niuniu Zhang measured wash trading directly from public on-chain data, tracing wallets instead of inferring manipulation from statistical patterns, and they trained a machine learning model on the results.
How the Study Identifies Wash Trades
The researchers pulled every recorded sale from LooksRare (401,636 transactions), Blur (3,503,420) and OpenSea (21,514,100) through Alchemy’s NFT sales API. Each record lists the buyer, seller, collection, token ID, price in ETH and timestamp. The datasets span December 2021 to April 2023 on LooksRare, October 2022 to March 2024 on Blur and February 2022 to March 2024 on OpenSea, and total 10,026,162.88 ETH, 3,507,602.25 ETH and 5,910,280.56 ETH in traded value, respectively.
Four filters mark a sale as wash trading: a wallet selling to itself, an NFT returning to a previous owner within the same collection, one wallet buying the same token three or more times, and a common funder whose Ether reached both buyer and seller. The authors removed smart contracts and centralized exchange addresses from the funding filter to limit false positives.
Dune Analytics researcher hildobby proposed a similar four-filter method in 2022 and put wash trading at almost 45% of Ethereum NFT volume, while Chainalysis identified 262 users who sold NFTs to self-financed addresses more than 25 times.
Wash Trading Share Varies by Marketplace
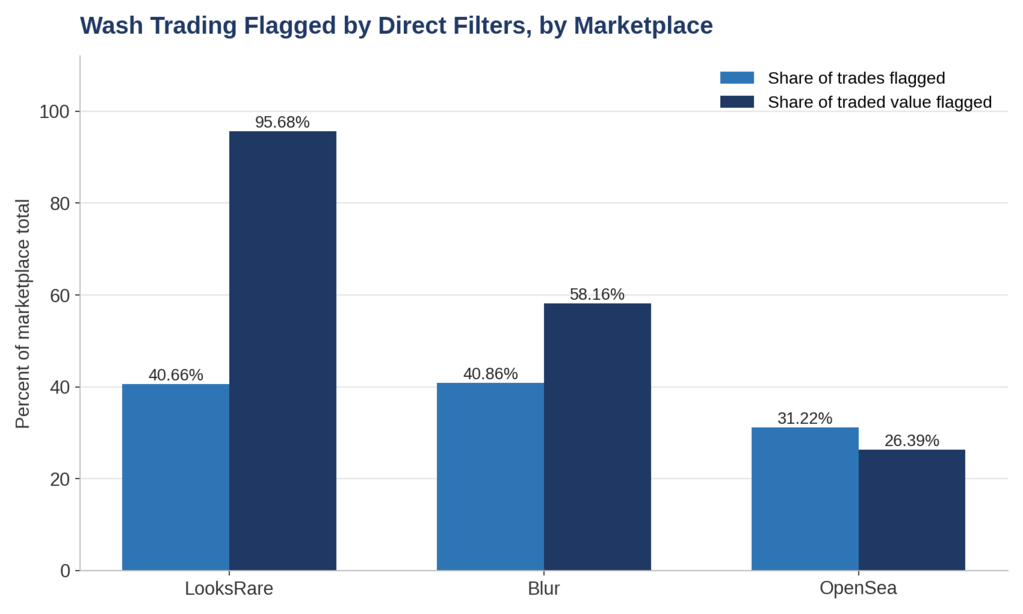
The combined filters flagged 40.66% of trades on LooksRare, 40.86% on Blur and 31.22% on OpenSea, an average of 37.58%. The share of traded value differs more: 95.68% on LooksRare, 58.16% on Blur and 26.39% on OpenSea, an average of 60.08%.
The common-funder filter produced most of the flags: 36.6% of LooksRare trades, 35.52% of Blur trades and 25.91% of OpenSea trades. The back-and-forth filter flagged 7.51% of LooksRare trades, 7.2% of Blur trades and 0.56% of OpenSea trades, while the three-purchase filter flagged 8.91%, 5.17% and 6.89%. The self-sale filter flagged 0.15% of trades or fewer on each marketplace. LooksRare paid LOOKS tokens for trading activity, Blur grew past OpenSea through incentive programs, and NFTs add royalties, zero-fee models and price opacity as drivers.
Prices Rise, Profits Do Not
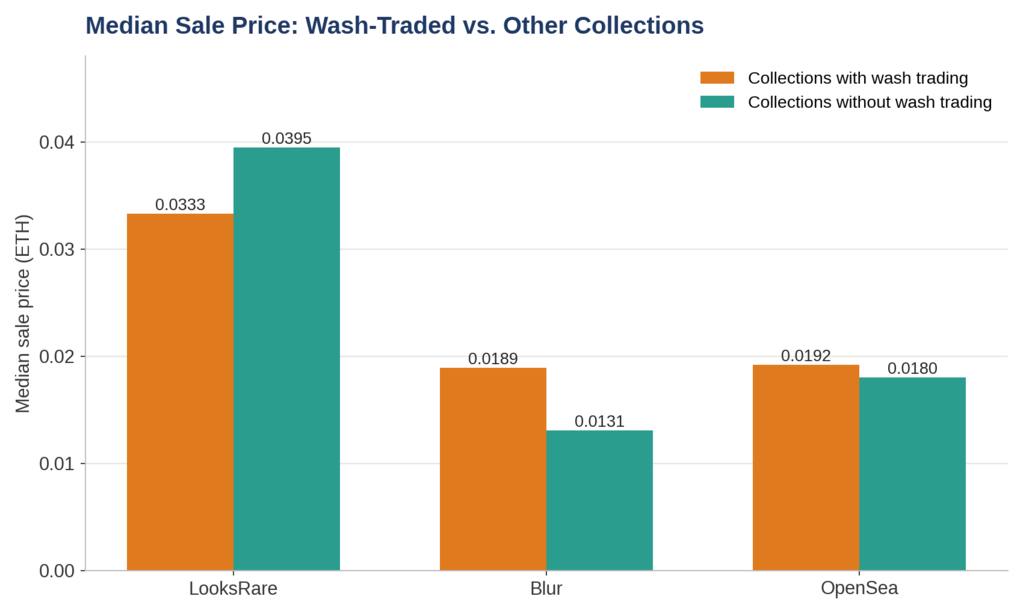
Collections with wash trading showed higher median sale prices on Blur (0.0189 ETH against 0.0131 ETH) and OpenSea (0.0192 ETH against 0.018 ETH), and lower prices on LooksRare (0.0333 ETH against 0.0395 ETH). The authors merged linked wash-trading wallets into 6,643 groups on LooksRare, 2,007 on Blur and 13,194 on OpenSea, and the median wash trader profit stayed near zero ETH on all three. Legitimate traders earned median profits of 0.01672 ETH on LooksRare and 0.014515 ETH on Blur.
Roundedness Regression Needs Per-Exchange Tuning
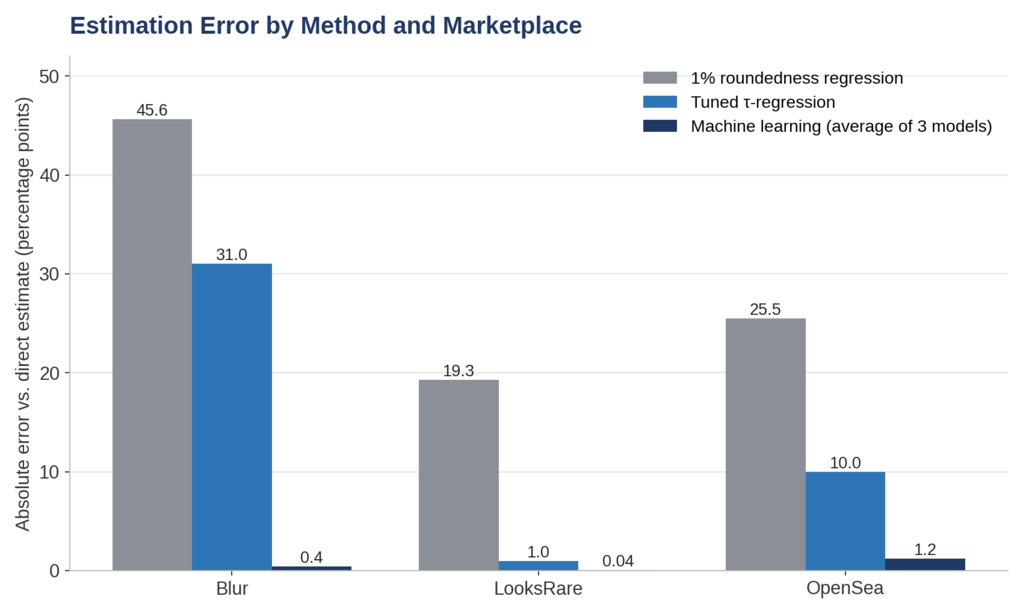
The tested roundedness regression of Cong et al. (2023), which regresses weekly unrounded volume on rounded volume in logarithms and reads the excess as wash volume. Cong et al. estimated an average above 70% of reported volume on unregulated centralized exchanges. With the original 1% roundedness threshold, estimates missed the direct results by 45.52 percentage points on Blur, 19.29 on LooksRare and 25.53 on OpenSea.
Calibrating the threshold for each marketplace narrowed the gap, with optimal values of 9.09% for Blur, 8.18% for LooksRare and 0.21% for OpenSea. The τ-regression cut the LooksRare error from 19.29 to 1.03 percentage points, while the Blur error stayed at 30.99 points.
Machine Learning Improves NFT Wash Trading Detection
The authors built a trade-level classifier from XGBoost, random forest and TabNet deep learning models. The 16 input features include the regression estimate, price, price deviation from the token’s previous sale, time since the last trade, and buyer and seller trade counts over 24 hours and seven days. TabNet applies an attention mechanism which weights features for each trade. The direct filters supplied the labels and stayed outside the feature set. The strongest predictors were time since the last trade, the buyer’s seven-day trade count, price deviation and the buyer’s seven-day count of trades within the collection.
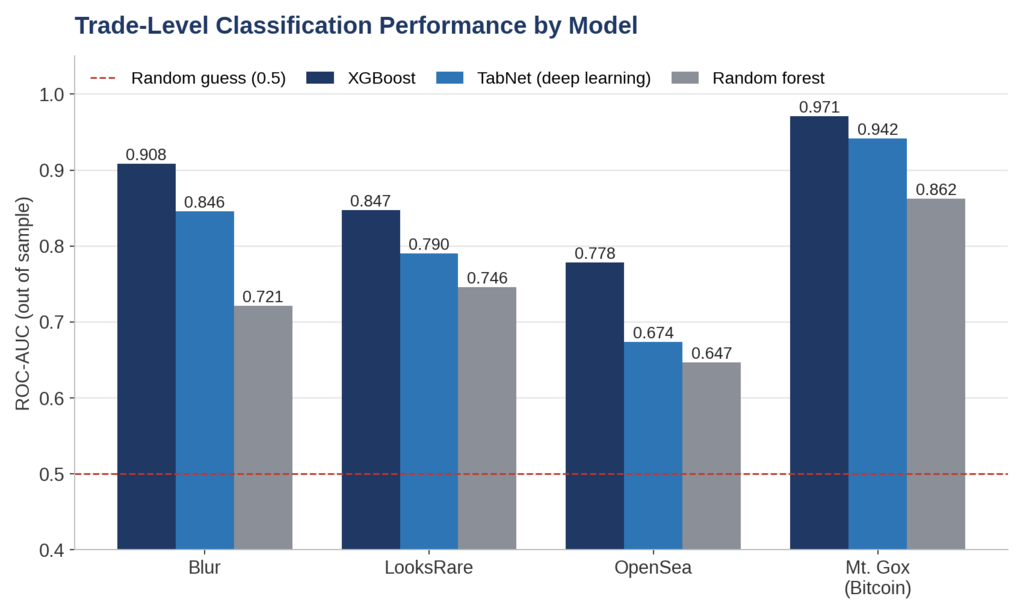
Out of sample, XGBoost reached ROC-AUC scores of 0.908 on Blur, 0.847 on LooksRare and 0.778 on OpenSea, with aggregate wash-value errors of 0.02%, 0.01% and 0.12%. The largest aggregate error across all models and marketplaces was 2.15%, from the deep learning model on OpenSea, and the mean error was 0.54%.
Random forest scored lower, with ROC-AUC values of 0.721 on Blur, 0.746 on LooksRare and 0.647 on OpenSea, and the deep learning model scored 0.846, 0.790 and 0.674. Because the labels come from the filters, the figures measure agreement with the direct estimates, not with independently confirmed wash trades.
On 5,539,244 Mt. Gox bitcoin trades from June 2011 to May 2013, using labels from the filters of Aloosh and Li (2024), XGBoost reached a ROC-AUC of 0.971 and an aggregate error of 0.03%. Aloosh and Li built their labels from leaked exchange records, and the roundedness regression estimate ranked fifth among the 16 features.
Distributional Tests and Regulatory Use
Three distributional tests borrowed from Cong et al. performed poorly on NFT data: Benford’s Law, trade-size clustering and power-law tail exponents. Both wash and legitimate trades deviated from Benford’s Law, and legitimate trades deviated more. Clustering around round numbers appeared weakly, and tail exponents did not separate the two groups; the authors treat all three as unreliable diagnostics for NFT markets.
United States law has banned wash trading in securities and commodity markets since 1936, the CFTC fined Coinbase $6.5 million in 2021 over reporting violations and wash trading by a former employee, and ESMA has issued supervisory guidelines for detecting market abuse under MiCA.

Isai Alexei is a journalist and financial analyst covering cryptocurrency markets and traditional securities for Blockchaindose. He has spent ten years analyzing digital assets, trading activity, and market structure.