

NFT visual traits carry measurable price premia and discounts in major Ethereum collections, and the size of the premia changes with market conditions, according to a paper by Samiha Tariq, a PhD candidate in economics at Southern Illinois University Carbondale. The study analyzes 94,039 secondary-market sales from 26 generative collections between January 2021 and March 2025.
Data and Image Features
The sample draws 26 collections of roughly 10,000 tokens each from the OpenSea top 30, using a random 10% of tokens plus 200 extra tokens per collection as a buffer for missing metadata. After cleaning, the panel holds 24,148 unique NFTs, and prices convert from ETH to USD at the trade-day rate, treating each sale as a separate observation. Each image becomes a vector of 196 features: 31 classic design cues, 15 texture descriptors and 150 deep-learning components from ResNet-50 and VGG-19 outputs reduced by principal component analysis. Hue enters as sine and cosine terms to respect its circular scale.
Three-Stage Feature Selection
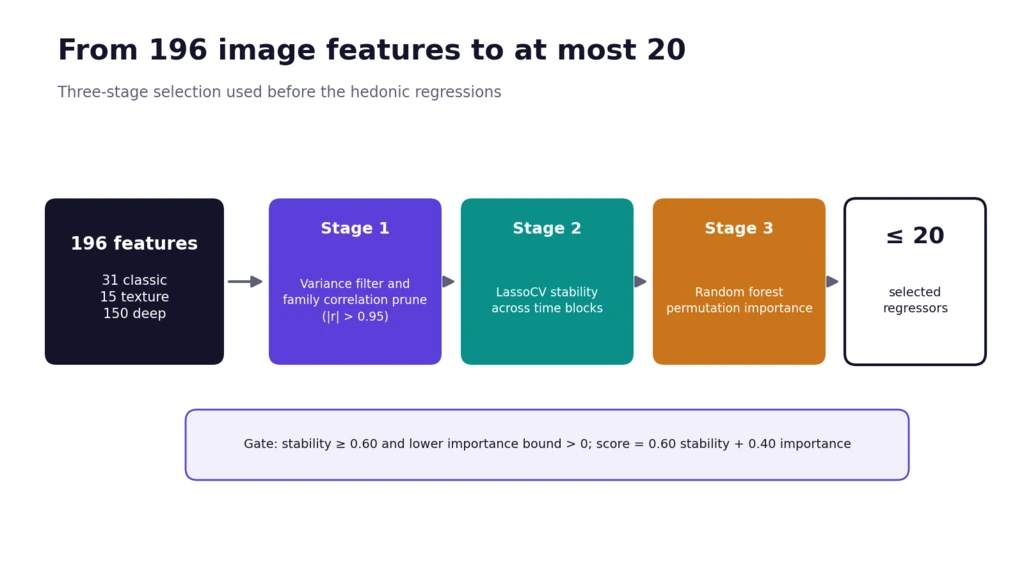
A three-stage filter reduces 196 candidate image features to a final set of at most 20 regressors by combining variance, correlation, stability and importance criteria. Stage one drops near-constant features and prunes pairs inside each feature family whose correlation exceeds 0.95. Stage two fits a LassoCV model across repeated time blocks and records how often each feature keeps a nonzero coefficient.
Stage three trains a random forest and computes permutation importance, and a blended score weights stability at 0.60 and importance at 0.40. Features pass when stability reaches 0.60 and the lower importance bound stays above zero, with minimum quotas for each feature family.
Static Model Specification
The static mixed-effects hedonic model regresses the log of one plus the sale price on selected image features, market returns and the Fear & Greed Index, with month fixed effects and random intercepts for each NFT and each collection. All regressors carry z-scores, so a coefficient describes the effect of a one-standard-deviation change. The estimation sample contains 67,072 sales across 21,818 NFTs. Random-intercept variances reach 0.591 at both levels, and an intraclass correlation near 0.60 indicates stable NFT and collection components explain most price variation.
Traits That Earn Premia
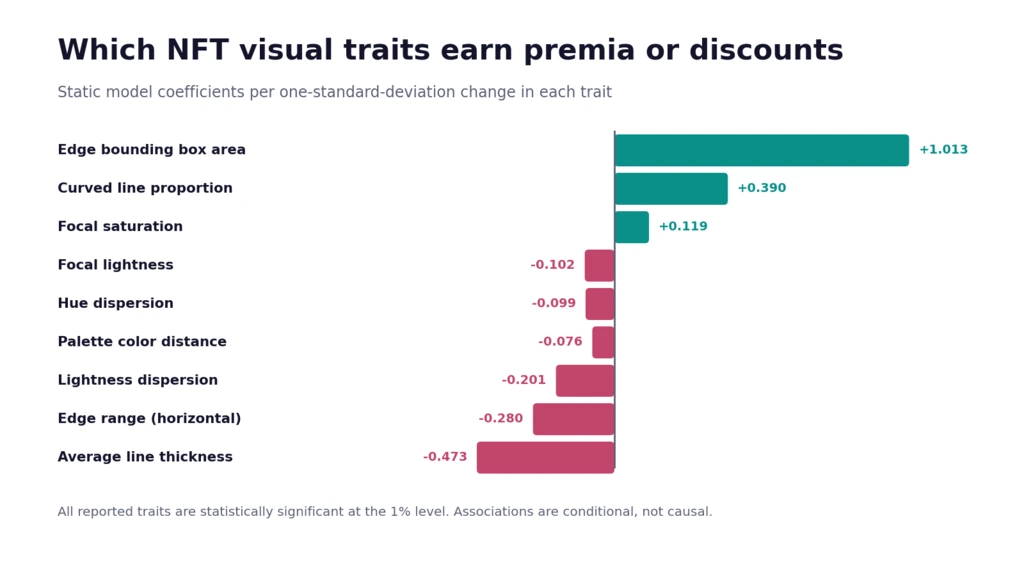
Compositional concentration and curvature draw the largest rewards among the explicit image traits selected for the static regression. Edge bounding box area carries a coefficient of 1.013, and the proportion of curved line segments carries 0.390, equal to about 47.7% higher expected price per standard deviation. Saturation in the central third of the image adds 0.119. Each figure comes from a model holding month effects, collection brand and market controls fixed, and a Benjamini–Hochberg correction for multiple testing leaves the main image results significant at the 1% level.
The Crypto Fear & Greed Index carries 0.152, equal to about 16.4% higher expected price for a one-standard-deviation rise, and SOL returns carry 0.060. ETH (−0.033) and BTC (−0.026) returns load negatively within the month once time effects enter, while S&P 500 and NASDAQ returns show no significant association. Most deep embedding components stay statistically weak after explicit traits enter the model, so the author concludes interpretable design features dominate in the sample, without ruling out value for embeddings in other specifications.
Cycle-Aware Dynamic Model
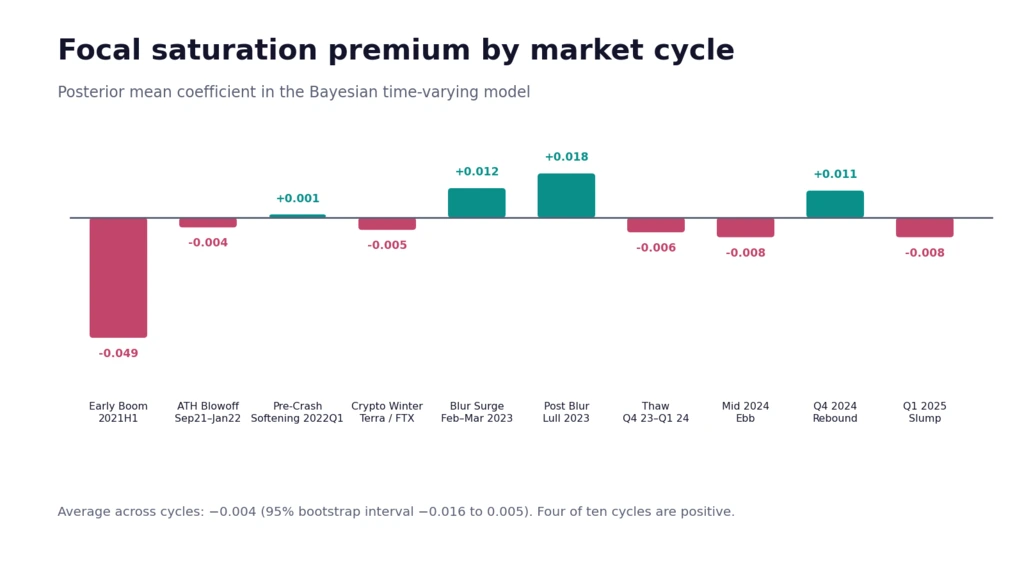
A Bayesian dynamic model divides the sample into ten hand-labeled market cycles and lets the coefficient on focal saturation vary by cycle across 37,126 NFT-by-cycle observations. The coefficient averages −0.004, with a cross-cycle standard deviation of 0.018, and a cycle-block bootstrap gives a 95% interval from −0.016 to 0.005. The model uses Student-t errors, whose 2.42 degrees of freedom reflect fat-tailed prices. Four of ten cycles show positive means: Post Blur Lull 2023 at 0.018, Blur Surge at 0.012 and Q4 2024 Rebound at 0.011. Early Boom 2021H1 shows −0.049, equal to about a 5% discount.
Brand Drift and Cycle Effects
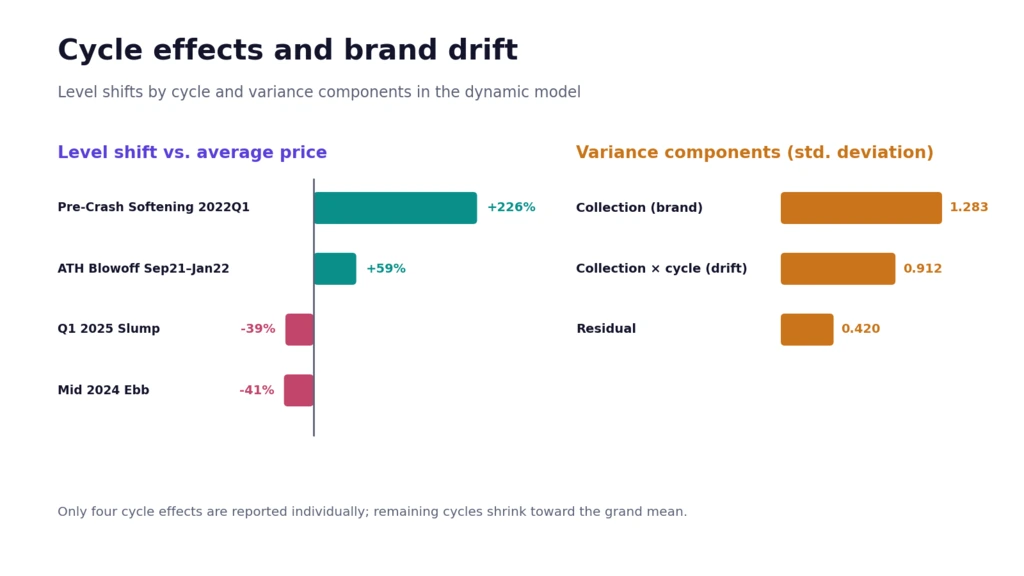
Cycle effects and brand terms absorb much of the price variation, and the dynamic model attributes more variance to them than the static model does. Pre-Crash Softening in early 2022 shows a level shift of 1.182, about 226% above the average, while Mid 2024 Ebb and Q1 2025 Slump sit near 41% and 39% below it.
The collection standard deviation reaches 1.283 and the collection-by-cycle deviation reaches 0.912, so brand premia drift with market state. The curvature coefficient falls from 0.390 in the static model to −0.075 in the dynamic model, and the author reads the change as a reallocation of variance toward brand and regime.
Comparison With Earlier Studies
Earlier work on CryptoPunks by Alsultan, Kourtis and Markellos, published in Economics Letters in 2024, found discounts for higher saturation and brightness, whereas the Tariq paper finds a premium for saturation inside the focal region and a discount for global lightness dispersion. Mekacher and co-authors found rarer NFTs sell for higher prices across 410 collections and 3.7 million transactions.
DappRadar counted 18.1 million NFT sales and $1.58 billion in trading volume in the third quarter of 2025, and part of the sales count reflected an OpenSea trader-rewards campaign ahead of a planned token. CoinGecko figures cited in 2026 put total NFT market capitalization near $1.7 billion in March, against more than $17 billion at the 2022 peak. Platforms face thinner liquidity than the cycles in the sample.

Isai Alexei is a journalist and financial analyst covering cryptocurrency markets and traditional securities for Blockchaindose. He has spent ten years analyzing digital assets, trading activity, and market structure.