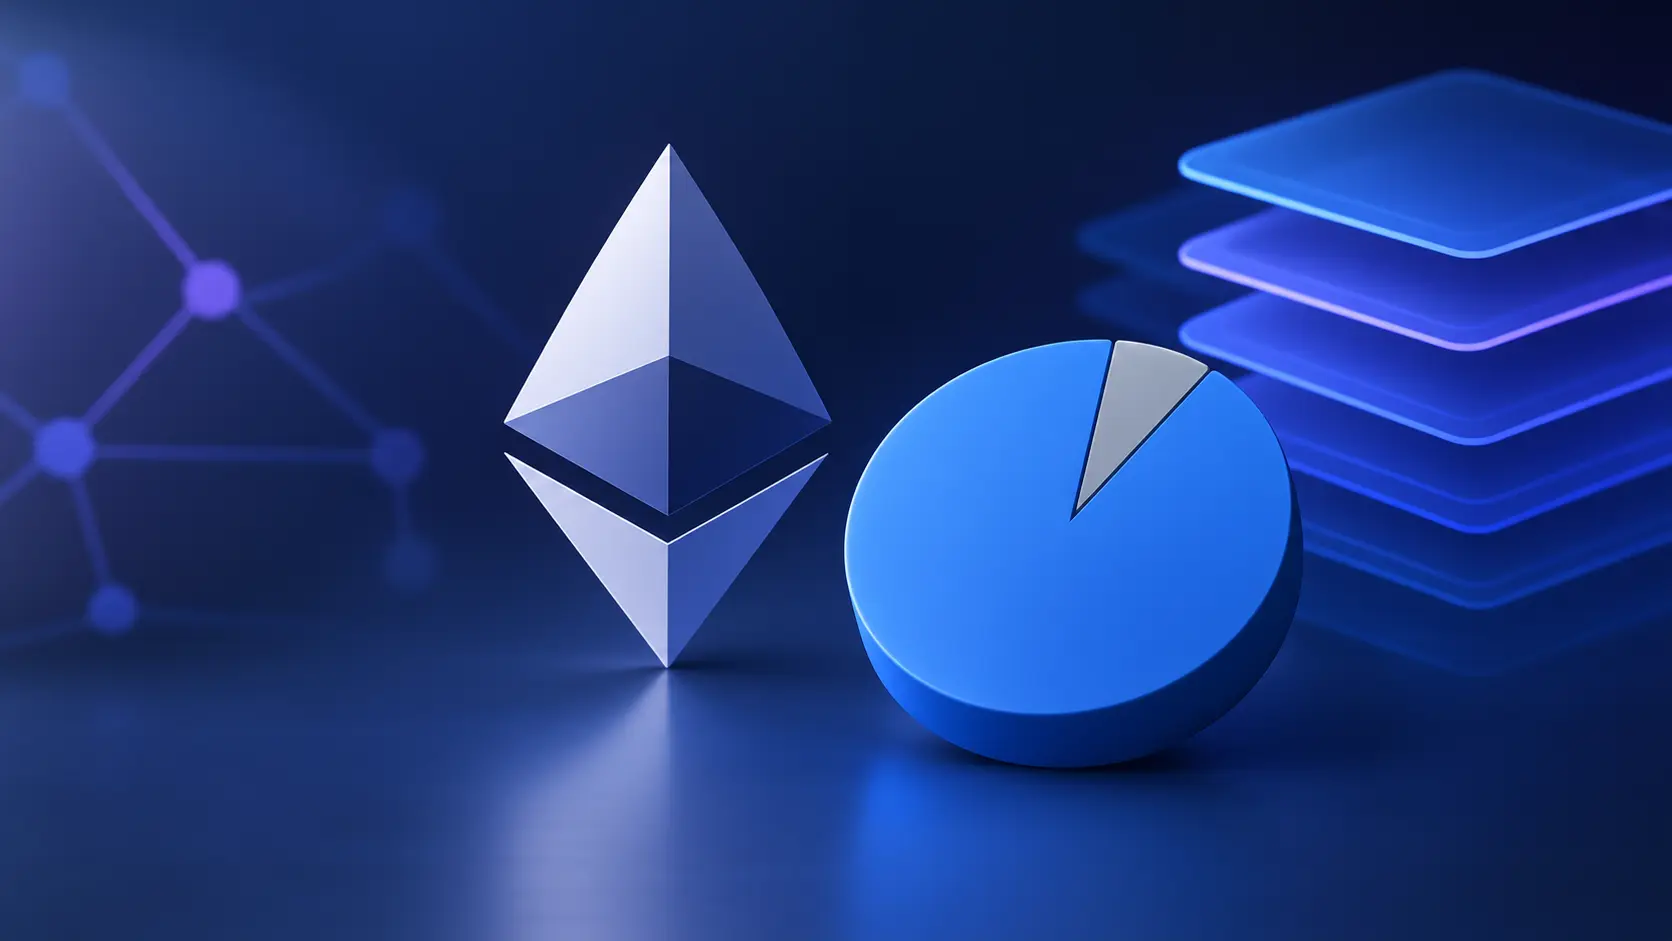
Ethereum, said to be the world’s second largest blockchain ecosystem is shrinking. It’s not a shrink of the ecosystem, No. Rather, it is a vast drop in the network’s share of decentralized finance and units. Since mid 2024, Ethereum L2 activity is seemingly beating the transaction count on mainnet.
Key takeaways
- L2s now handle roughly 94% of combined L1+L2 transactions, and about 97% of computational throughput.
- The shift has been building since 2023, accelerated sharply after the March 2024 Dencun upgrade, and has become the ecosystem’s default state by 2026.
- Despite dominating activity, L2s hold a much smaller share of value.
- The L2 landscape itself is concentrated.
- Raw transaction counts overstate genuine adoption unless paired with active-address, fee-revenue, and bot-filtering data.
Ethereum’s base chain, the one carrying the brand, and security guarantees now represents a small percentage of the day to day transaction volume.
A split that finally has a number attached to it
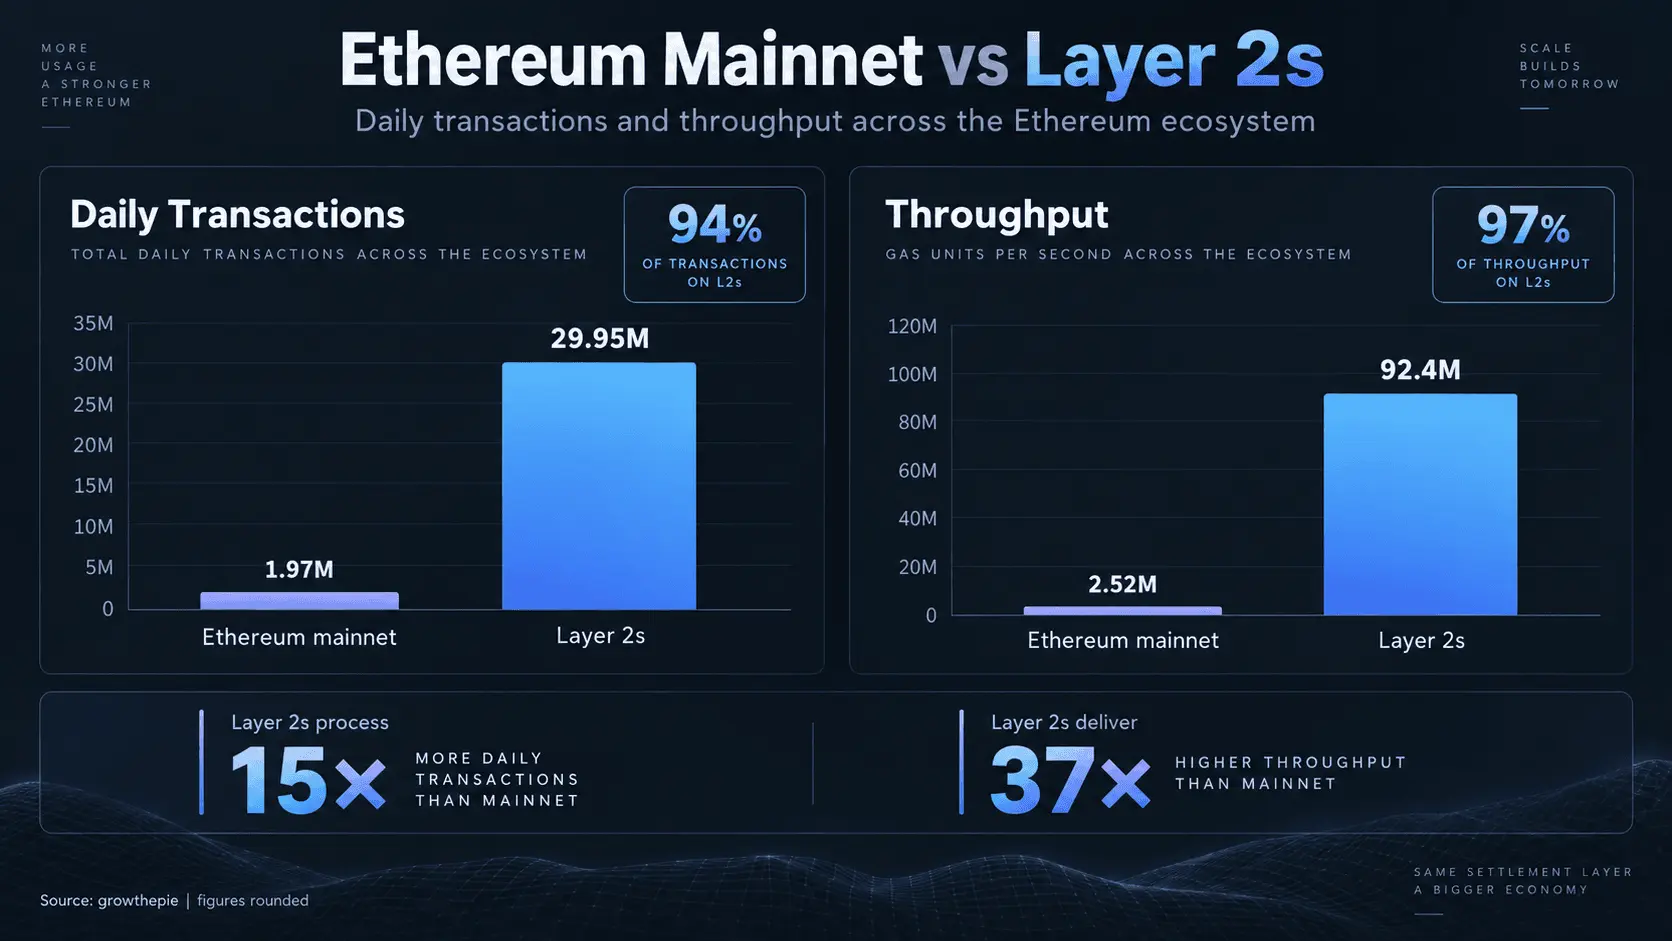
According to CryptoRank’s analysis of Growthepie data, Ethereum’s Layer 2 networks are currently handling about 29.95 million transactions daily. The Ethereum mainnet processes 1.97 million. This means Layer 2s account for roughly 94% of the total activity.
A look at the computational throughput rather than transaction counts sends the numbers even higher at 97% share for L2s. Rollups are processing about 92.4 million gas units per second, compared to 2.52 million on the mainnet.
All this data is saying is most of Ethereum’s transaction processing has moved away from the main network itself.
How we got here: three years, one major change
Till around 2023, majority of transactions happened via the Ethereum mainnet. At this point, L2s like Arbitrum and Optimism were still in the market but slowly gaining traction.
Base network briefly surpassed Optimism and Arbitrum in daily transactions in August 2023. But still, the mainnet was handling close to a million transactions daily. The rapid growth of these Layer 2 networks seemed more like an addition than a threat to the mainnet’s dominance.
On March 13, 2024 the Dencun upgrade was launched on Ethereum. It came under EIP-4844, with the latest additions being “blobs,” a cheaper way for rollups to submit their compressed transaction data to the Ethereum mainnet for final settlement.
Fees on L2s dropped substantially. The average transaction fee on Optimism dropped from around $2.44 to about $0.068 within days. Base saw its fees fall from roughly $1.21 to $0.196, and Zora’s fees went from $0.752 to just a fraction of a cent. Hence, average daily transaction activity on rollups roughly doubled, increasing from about 3.3 million to 6.65 million over a 150-day period.
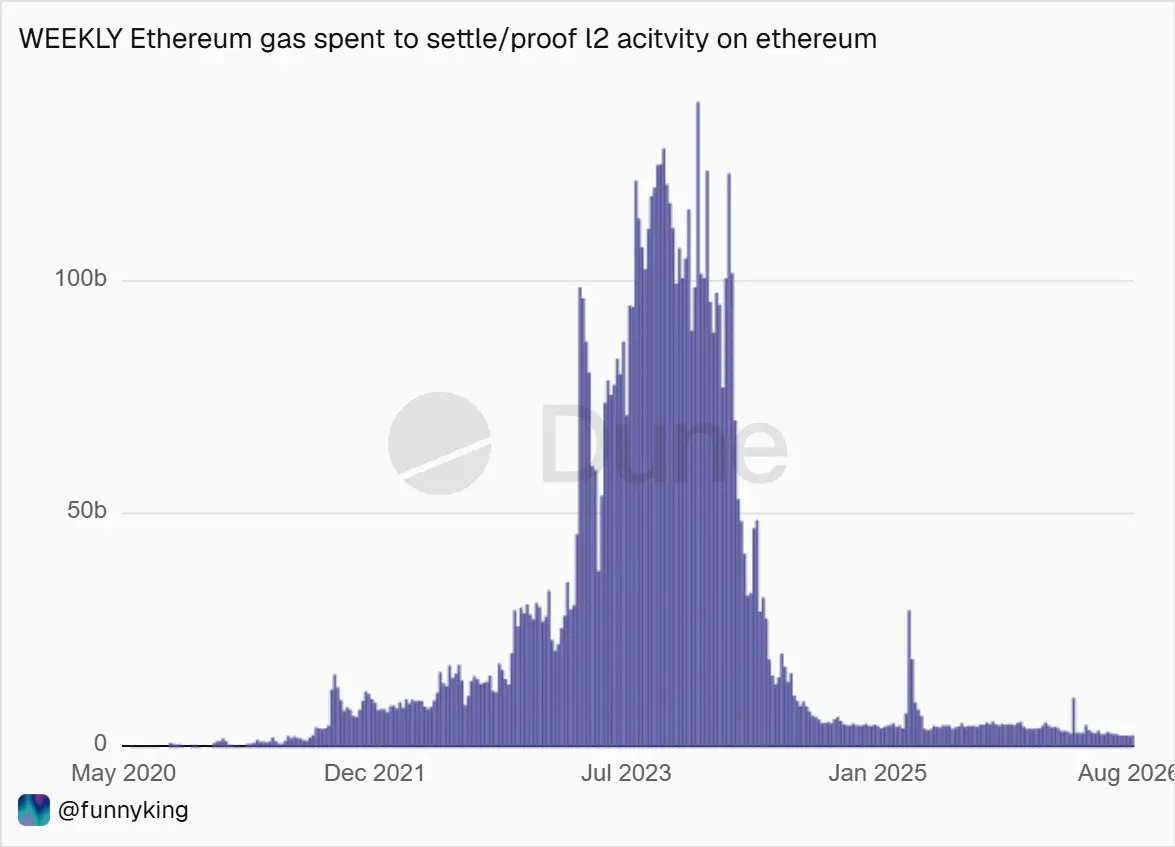
Charts from Dune analytics well display the significant changes in L2 fees, ever since the Dencun upgrade of March 2024. You can see a major fee drop, with only one minor spike in January 2025.
Layer 2 transactions increased from 135.6 million in January 2024 to 543.8 million by March 2026. Arbitrum surpassed the mainnet’s monthly transaction count in early 2024, and Base followed suit starting in April 2024 according to research.
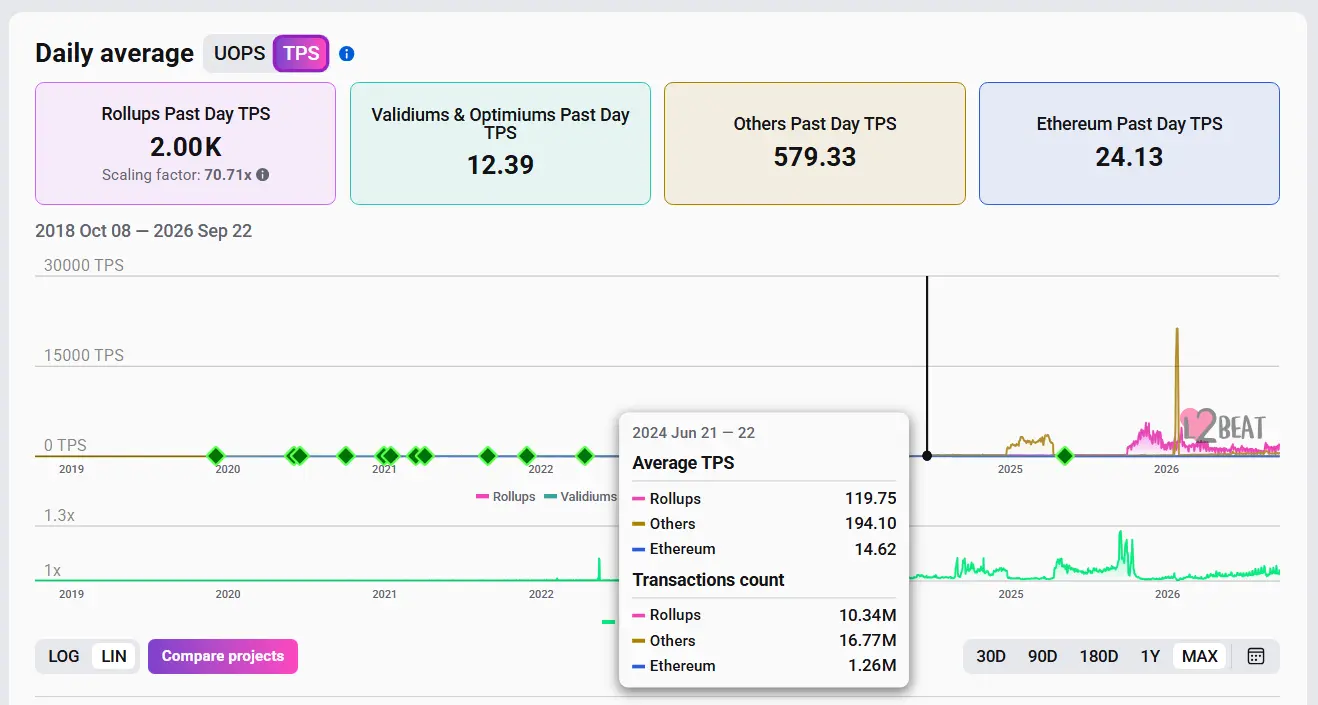
By 2025, Ethereum’s main network handled about 16.6 transactions per second, while its Layer 2 (L2) solutions processed around 227 TPS combined. This means L2s were nearly 14 times faster.
Transaction fees also showed a big difference. Mainnet fees reportedly dropped from about $3.79 in early 2024 to $0.165 by 2025, while the average fee on leading L2s went down to less than a quarter of a cent.
This year, the fact that 94% of transactions happen on L2s isn’t a sudden change, but rather the result of a trend over several years finally reaching a noticeable point.
Most activity is on L2s, but most of the money isn’t
What makes this story interesting and not just about Ethereum being replaced is that the money hasn’t moved off the main chain with the transactions. According to CryptoRank, about $162 billion in stablecoins and $49 billion in total value locked in DeFi are still on the Ethereum mainnet. L2s only hold about $12 billion in stablecoins spread across them.
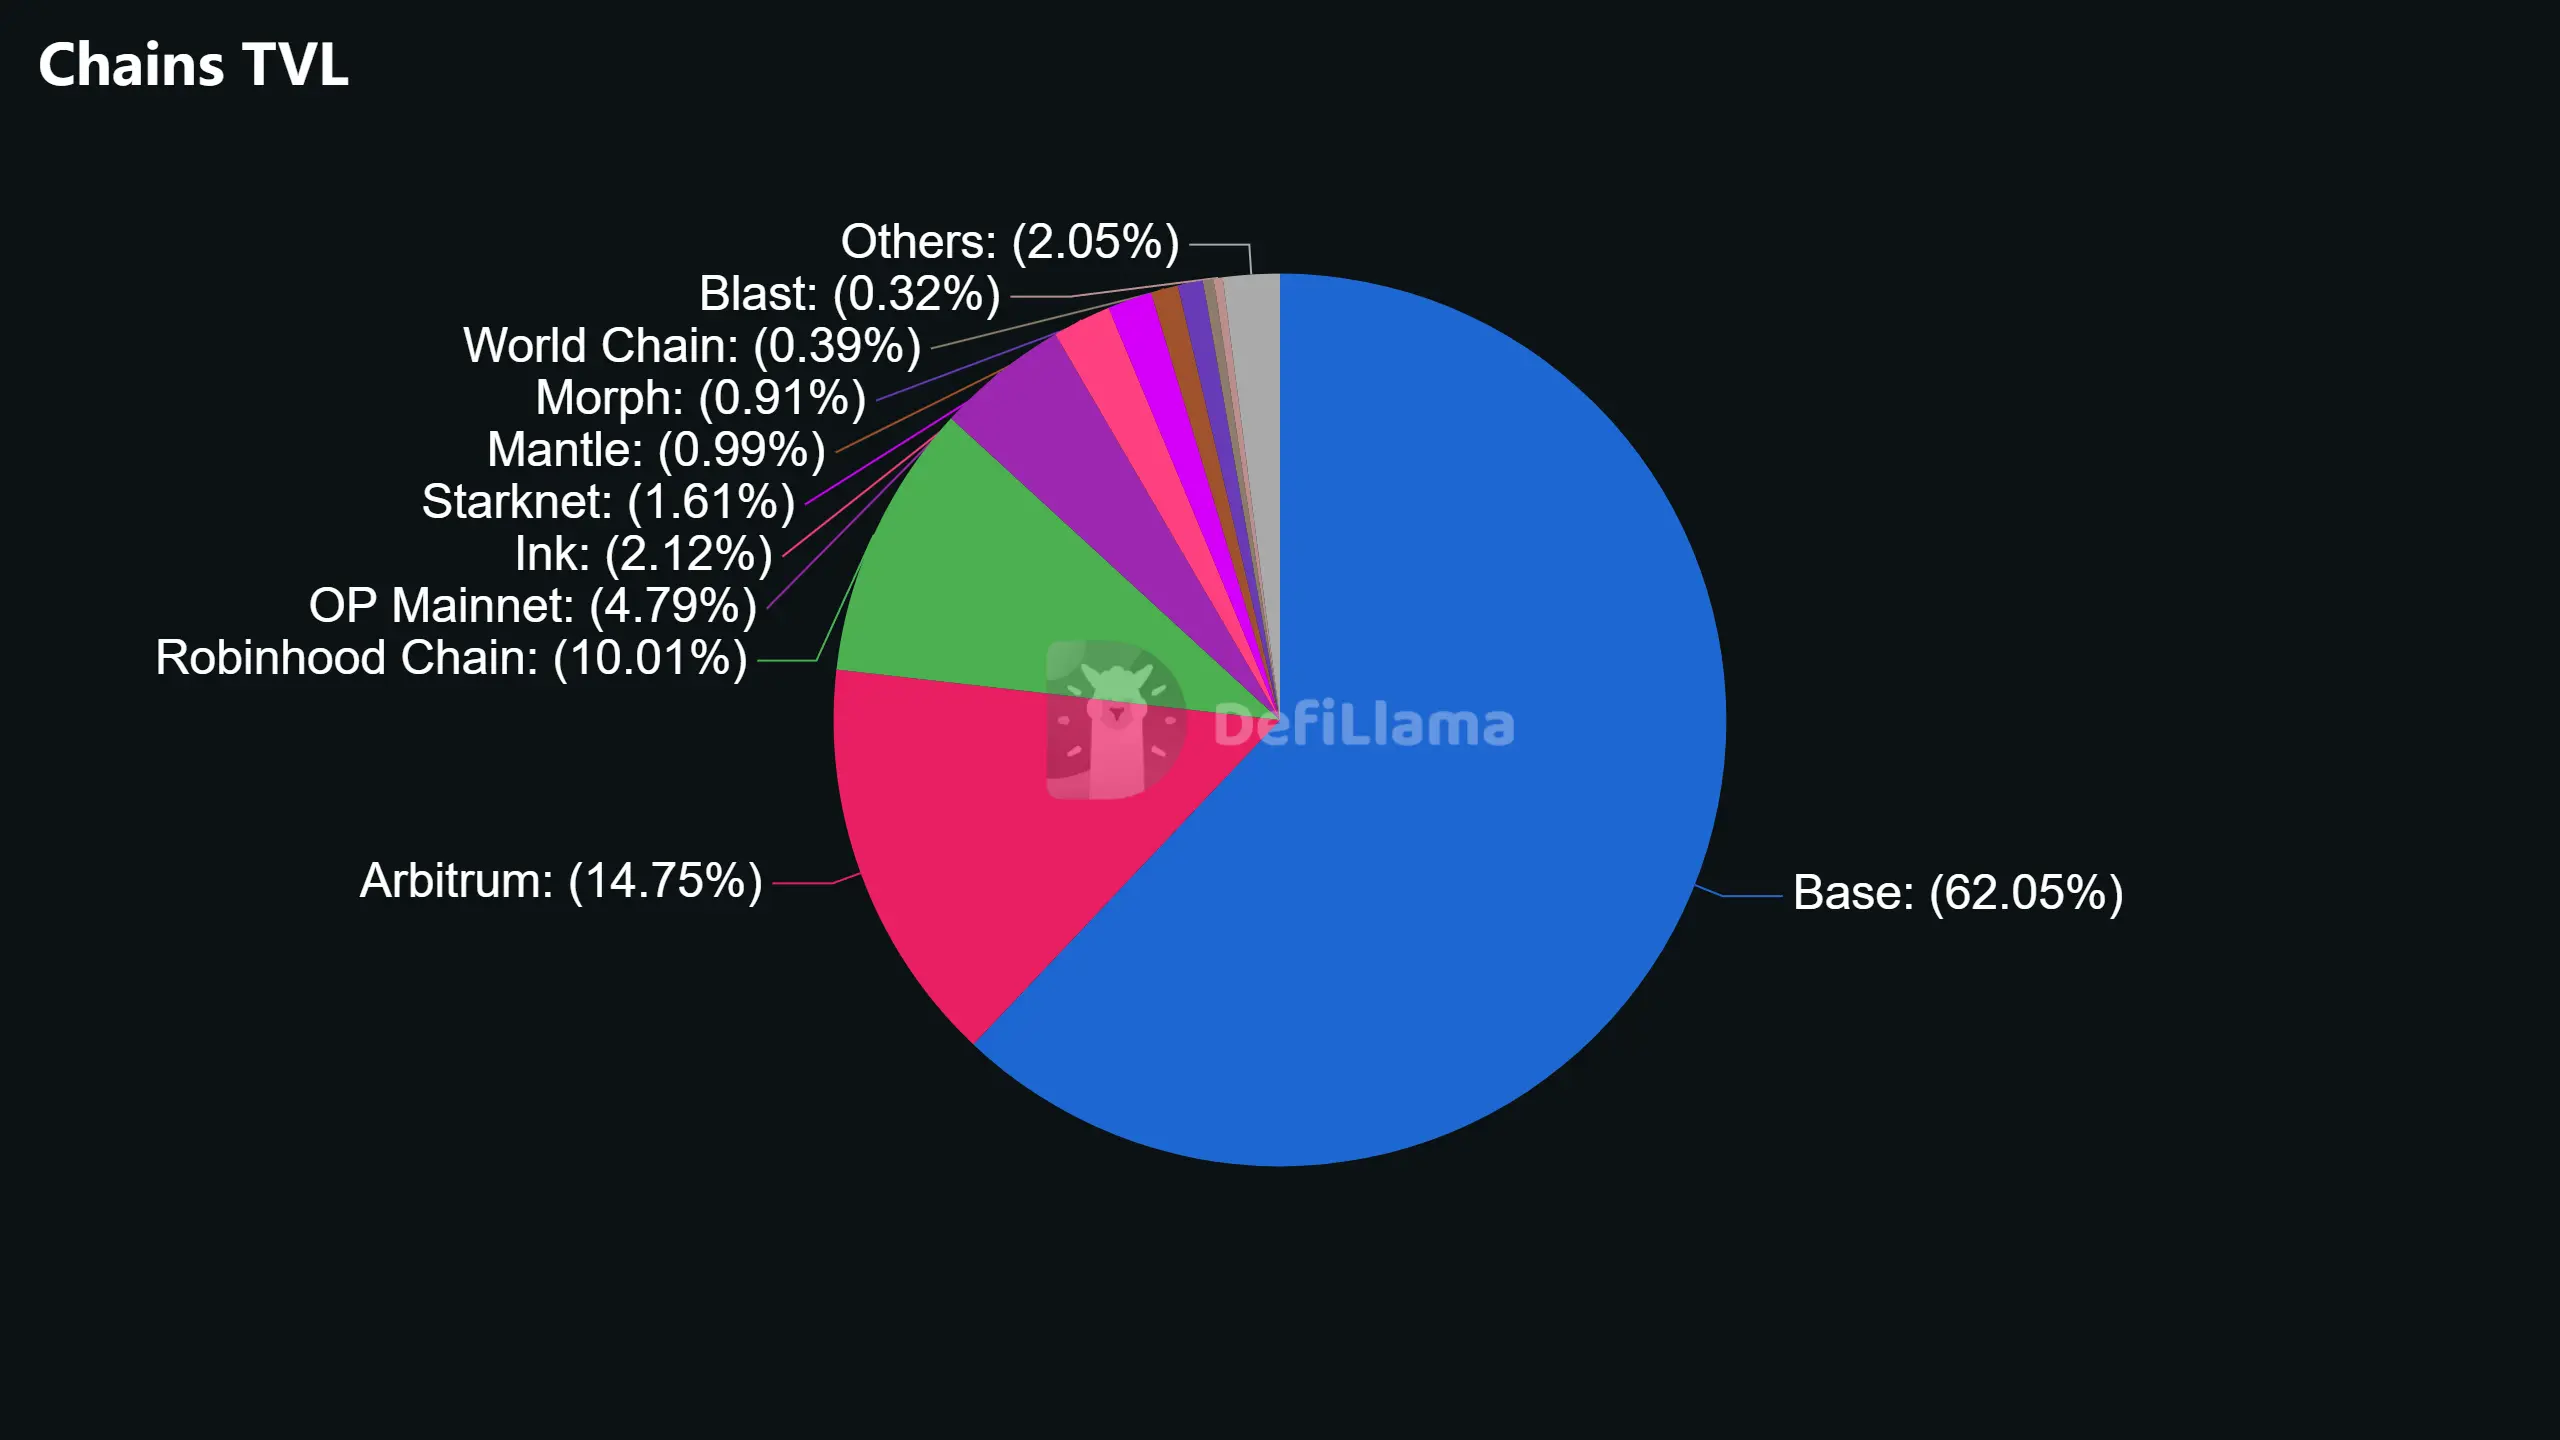
Another report from L2BEAT shows that Base ($14.7 billion) and Arbitrum ($10.75 billion) together hold about 78% of the roughly $32.6 billion secured across major L2 networks. Other L2s like OP Mainnet, Mantle, Starknet, Linea, and zkSync Era hold much less.
This difference is perhaps more significant than the 94% statistic itself. It suggests a division of tasks rather than a complete move. High-value transactions, institutional money, stablecoins, and large DeFi positions are staying on the main Ethereum network for its security.
Meanwhile, frequent, lower-value activities like trading, transfers, gaming, and social applications have moved to cheaper L2s. The Ethereum mainnet is increasingly acting as the place for final settlement, data storage, and as collateral, while L2s are the user-facing platforms built on top of it.
Ethereum L2 activity itself is also unevenly distributed
The L2 ecosystem is not evenly spread out. Data from 21Shares’ “State of Crypto” indicates that Base, Arbitrum, and Optimism handle around 90% of all L2 transactions, leaving over fifty smaller chains to share the remaining 10%. Base alone is reported to have about 70% of active addresses among Ethereum L2s.
L2BEAT activity data has also shown Base processing over 300 million operations in a 30-day period, significantly more than Arbitrum and OP Mainnet during the same time.
Looking specifically at DeFi, CryptoRank reports that over 337 million L2 DeFi transactions occurred in 30 days, according to Growthepie data. This accounts for about 99% of all DeFi transactions across both L1 and L2. Uniswap alone generated over 57 million L2 transactions in that month. This is important because it shows the shift isn’t just for small transfers or speculation. Core financial activities, including one of the main DeFi applications, have also largely moved to L2s.
Here’s why the footnote is needed for that number
A 94% share of transactions is a strong sign of how things are being processed now. But it doesn’t automatically mean 94% of people are using it. If you assume it does, it’s easy to argue against.
A few points to consider:
- Transaction counts aren’t the same as users. Right now, Ethereum’s main network has about 618,000 daily active addresses, according to Etherscan. The top Layer 2 networks combined seem to have between 1.3 and 1.8 million. Since Layer 2 fees are so low, one wallet can make dozens of transactions a day. On the main network, where fees are higher, people use their addresses less often.
- Not all transactions are the same. Low fees also encourage automated and repeated activity. Some of the increase in transaction numbers on L2s come from bots, and other automated formats.
What to say
Ethereum has essentially created and is now running a two-layer economy. The base chain is designed for security and settlement, while a set of execution environments are optimized for speed and cost.
Is this an accident? NO! This was a planned outcome. The fact that this is now clear in a simple statistic is very useful. It gives investors, developers, and regulators a quick way to understand a structural change that has been slowly developing since 2023.

Dan is a seasoned crypto writer for Blockchaindose who got his start in the space back in 2019. Over the past four years, he’s built a solid grasp of how the industry moves, focusing heavily on DeFi, NFTs, GameFi, and promising new projects.
Off the clock, you’ll usually find him buried in a good book or kicking back with a movie. His blend of hands-on market experience and straightforward commentary makes him a clear, trusted voice across the platform.