

NFT market correlations among Ethereum collections are weaker than correlations in cryptocurrency, stock and Forex markets, and they deviate from pure noise, according to a study by Marcin Wątorek, Paweł Szydło, Jarosław Kwapień and Stanisław Drożdż, posted in April 2024. The authors apply random matrix theory, detrended cross-correlation coefficients and minimal spanning trees to 90 collections over 500 days.
Dataset and Sampling
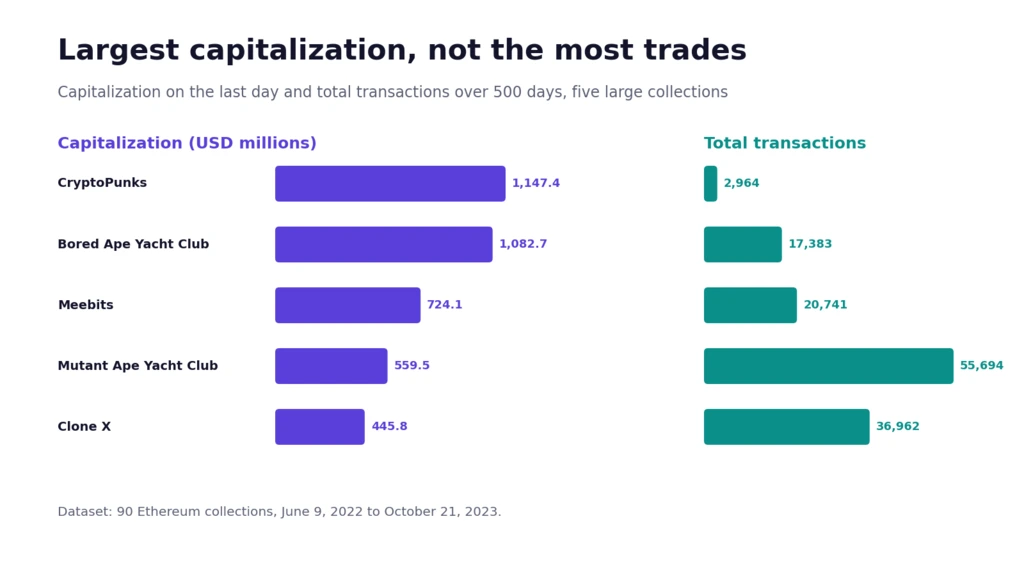
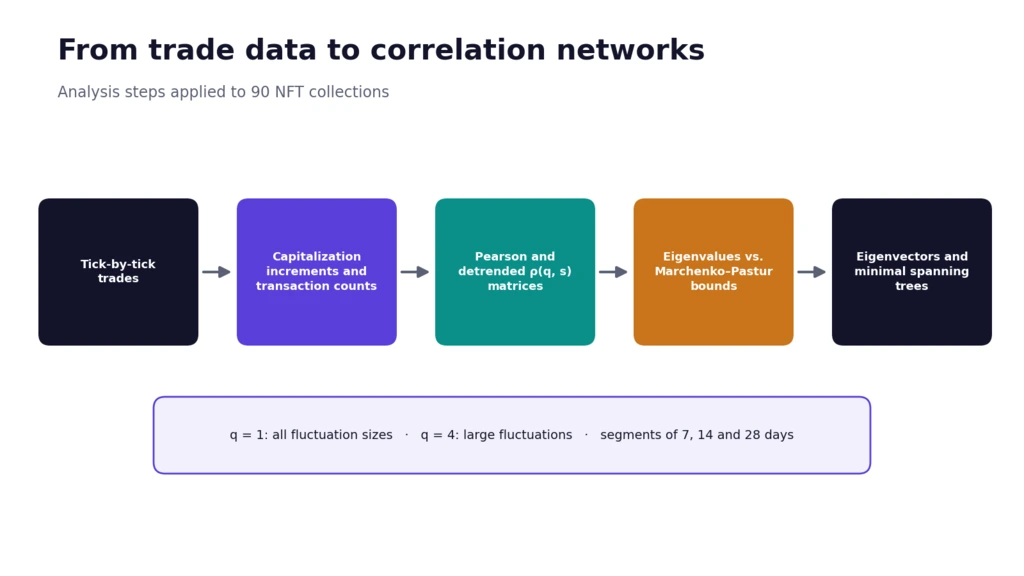
The dataset holds tick-by-tick transactions from the CryptoSlam portal for 90 Ethereum collections between June 9, 2022 and October 21, 2023. A collection qualified when it averaged at least two transactions, and each series became logarithmic increments of USD capitalization plus the number of transactions per time unit.
The study samples hourly for the 13 most liquid collections, defined by empty trading hours below 50% of the period, and daily for all 90. Most collections lost capitalization over the window, in line with the market downtrend. CryptoPunks held the largest capitalization on the last day at $1,147.4 million, Bored Ape Yacht Club followed at $1,082.7 million, and Mutant Ape Yacht Club recorded the most transactions at 55,694.
Activity Patterns and Outlier Events
Trading activity follows a daily cycle with a peak near 12:00 UTC, equal to 8:00 a.m. in New York, and two smaller peaks at 16:00 and 18:00 UTC. Milady Maker gained capitalization in April and May 2023 and recorded about 1,600 transactions on May 10, 2023, the day of a tweet from Elon Musk about the collection. A second event on January 6, 2023 lifted transactions and cut capitalization across less liquid collections, including Alien Frens, Killer GFs, Karafuru, Goblintown and 3Landers. CryptoPunks, despite the largest capitalization, recorded only 2,964 transactions in the window.
Heavy Tails and Long Memory
Absolute capitalization increments show heavy tails, with power-law exponents between 1.5 and 2.0 for most collections, while Bored Ape Yacht Club and Mutant Ape Yacht Club fit a stretched exponential with an exponent near 0.35. Transaction counts show lighter tails than capitalization, with stretched-exponential exponents between 0.3 and 0.4. Autocorrelation decays slowly and persists for several hundred hours, which signals long-range memory. For Mutant Ape Yacht Club, the Hurst exponent reaches 0.62 for capitalization and 0.65 for transactions, and multifractal structure appears only for medium and large fluctuations.
Detrended Correlation Method
Heavy tails and long memory led the authors to pair the Pearson coefficient with the q-dependent detrended cross-correlation coefficient, derived from multifractal detrended fluctuation analysis. The coefficient handles nonstationary series and measures correlation across time scales. The parameter q selects fluctuation size: values below 2 emphasize small fluctuations, and values above 2 emphasize large ones.
The study uses q equal to 1 and 4, polynomial detrending of order two and segment lengths from 7 to 28 days, and compares eigenvalue spectra with the Marchenko–Pastur distribution for random matrices. The Marchenko–Pastur bounds mark the eigenvalues expected from uncorrelated Gaussian series.
A Weak Market Factor
Several eigenvalues of the Pearson matrix exceed the Marchenko–Pastur bounds, so the correlations are statistically significant, and the largest eigenvalue sits well outside the random bulk. The gap between the largest eigenvalue and the rest is smaller than in other financial markets, which indicates a weak market factor. Detrended matrices with q equal to 1 and 4 show a weaker factor still, and correlations grow with time scale, a pattern typical of financial markets.
Comparing Pearson and detrended results suggests global correlations arise from higher-frequency fluctuations. Eigenvalues two through four also deviate from the random prediction, most visibly the second for transactions, which indicates tighter grouping among transaction series.
Small Collections Drive the Factor
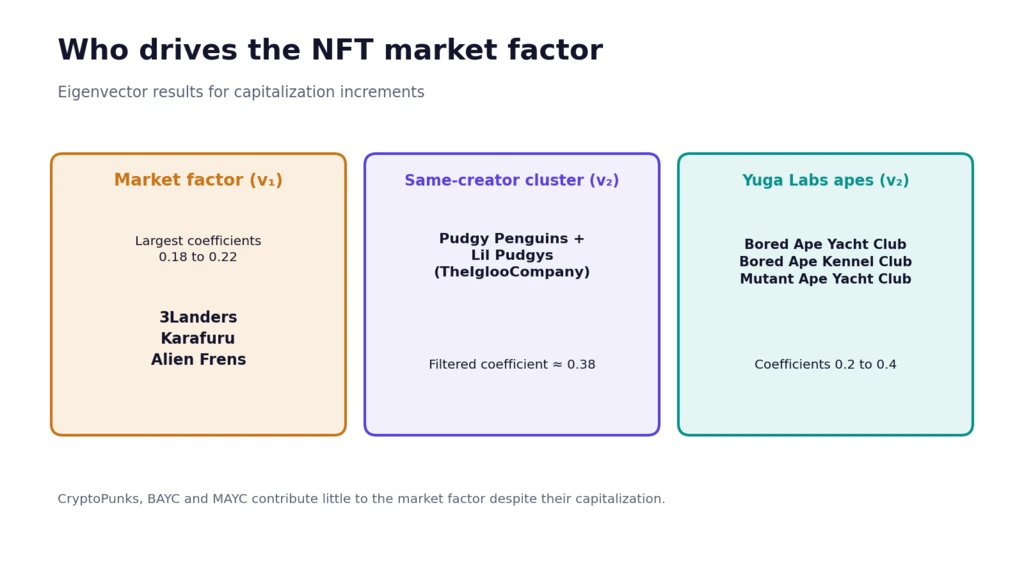
Eigenvector components show the market factor does not originate in the largest collections by capitalization or liquidity, and the largest contributions come from smaller ones. Mutant Ape Yacht Club, Bored Ape Yacht Club and CryptoPunks contribute little, while 3Landers, Karafuru and Alien Frens carry the largest coefficients, between 0.18 and 0.22. Lil Pudgys and Sappy Seals carry small negative coefficients, and for q equal to 4 the largest detrended coefficients, from 0.25 to 0.31, belong to Chain Runners, Robotos, Galaxy Eggs, Alien Frens and Cool Cats.
The authors trace large matrix elements to synchronous events among less liquid collections, including the January 6, 2023 activity rush, and extreme detrended correlations for transactions exceed 0.9 even at the shortest scale of seven days.
Group Structure Inside the Market
The second eigenvector reveals clusters of collections tied to common creators, and removing the variance of the largest eigenvalue sharpens the pattern. Pudgy Penguins and Lil Pudgys, both released by TheIglooCompany, move together in capitalization, and the Yuga Labs collections Bored Ape Yacht Club, Bored Ape Kennel Club and Mutant Ape Yacht Club form a second cluster with coefficients between 0.2 and 0.4.
Transaction counts cluster differently: the most liquid collections group together, and the least liquid ones, including CryptoBatz, Webbland and Coolman’s Universe, carry opposite-sign coefficients. After the filter, the TheIglooCompany collections reach coefficients near 0.38, and Lives of Asuna carries the largest opposite-sign coefficient.
Decentralized Minimal Spanning Trees
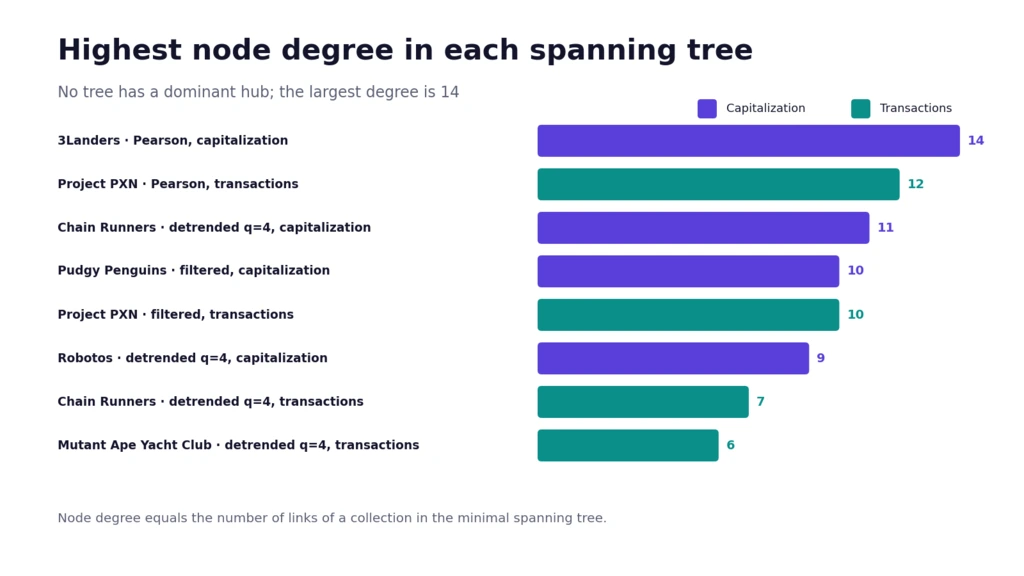
Minimal spanning trees built from the correlation matrices show decentralized networks without a dominant hub. In the Pearson capitalization tree, 3Landers has the highest degree at 14 and anchors a community of 15 collections, and Project PXN leads the transaction tree with degree 12. Detrended trees for large fluctuations center on Chain Runners, Robotos and Cool Cats, and CryptoPunks sits at the periphery in every capitalization tree.
Degree distributions of Pearson trees show a trace of power-law scaling, and detrended trees do not. Filtering the largest eigenvalue leaves the trees decentralized, with Pudgy Penguins and Project PXN at degree 10 in the capitalization and transaction trees, respectively.
Why NFT Correlations Differ
The authors attribute the weaker links to trading mechanics rather than to lower liquidity and market age alone, since NFT venues work differently. NFT venues lack an order book, and token non-fungibility blocks simple arbitrage, so information moves more slowly within a collection and between collections. Price evolution of the largest, most traded collections does not set the pace for cheaper ones, unlike stocks, currencies and cryptocurrencies, where the largest assets dominate and couple to each other.
The study cites a market capitalization near $21 billion in May 2022 and about $5 billion in April 2024, and it reports Ethereum at 72.3% of 2023 trading volume, with Bitcoin Ordinals at 42.1% in December 2023. CoinGecko data cited in 2026 put total NFT market capitalization near $1.7 billion in March, and DappRadar counted 18.1 million sales and $1.58 billion in volume in the third quarter of 2025, partly from an OpenSea rewards campaign.

Isai Alexei is a journalist and financial analyst covering cryptocurrency markets and traditional securities for Blockchaindose. He has spent ten years analyzing digital assets, trading activity, and market structure.