


Here is a headline that sounds wrong: decentralized exchanges (DEXs) hit a record in July 2026, in the same month their trading volume sank to a near two-year low.
It is not a mistake. It is one of the least-noticed numbers in crypto right now, and it only makes sense once you stop looking at dollars and start looking at proportions.
The number hiding in plain sight
Start with the headline stat. In July, Decentralized Exchange spot volume equaled 24.14% of centralized exchange (CEX) spot volume, according to The Block’s data series. The Defiant reported that this was the highest reading since the series began in 2019.
Now the catch. In that same month, DEX spot volume fell about 26% from June, to roughly $130.77 billion, per Blockworks data cited by The Defiant. That was the lowest monthly total in nearly two years. Daily Decentralized exchanges volume topped $6 billion only once all month, on July 8.
So DEXs shrank and still gained ground. The reason is simple: the other side shrank faster.
Why a share can rise when volume falls
Think of it as a pie. If your slice gets smaller but the whole pie gets much smaller, your slice can look bigger.
That is what happened. CoinDesk Research data, reported by CryptoSlate and CryptoRank, showed centralized exchange spot volume dropping 31.2% in July to $727 billion, its weakest month since October 2023. Decentralized exchanges volume in that dataset fell just 9.82%, to $176 billion.
The result: DEXs held a record 19.5% of combined spot volume, or nearly one in every five spot trades.
CryptoSlate’s analysis was blunt about the cause. The record came because the denominator shifted, not because DEX volume surged. CryptoRank added that leveraged trading held up better than spot during the slump, which means the pain was concentrated in spot markets, the exact place DEXs compete.
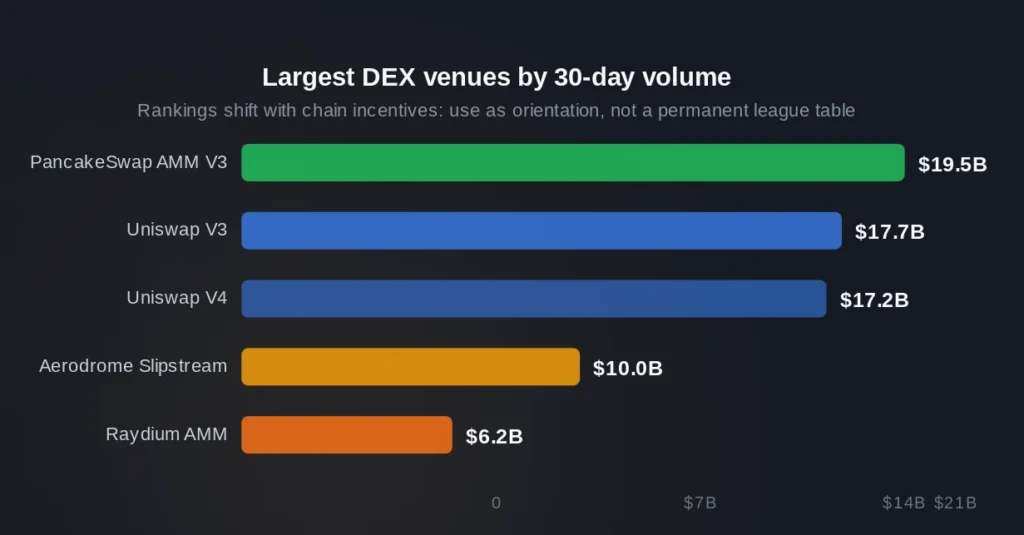
The Block pointed to real-world fallout on the centralized side. It noted that spot volumes dried up enough that firms such as Coinbase and Gemini cut staff, while some traders drifted toward onchain alternatives like Uniswap and Aerodrome.
Two numbers, two meanings
If you have seen both “24%” and “19.5%” and wondered which is right, the answer is both. They measure different things.
- 24.14% is a ratio: DEX volume divided by CEX volume. It says DEXs did about $24 of trading for every $100 on the covered centralized exchanges. The Block builds it from DefiLlama’s top 30 Decentralized Exchanges against a selected group of large CEXs.
- 19.5% is a share: DEX volume divided by DEX plus CEX volume combined. Convert 24.14% into a share of the combined pie and you land near 19.45%, almost exactly the same figure.
So these are the same story told two ways. Calling the 24% figure a “24% market share” would overstate it. Crypto.news and other outlets flagged exactly this point.
A fair question about “record”
Before you repeat the record claim, one caution. “Record” depends on whose data you use.
The Block’s earlier reports put the ratio at around 25% for May 2025 and almost 29% for June 2025. CoinGecko’s own series showed a 24.5% peak in June 2025, which it linked partly to trades routed through PancakeSwap after Binance Alpha 2.0 launched. Crypto.news noted that calling July 2026 an uncontested market-wide record goes beyond what the methodology disclosures support.
The safest phrasing is “a record in The Block’s current data series” and “a record in CoinDesk Research’s series.” It is still a notable moment. It is just a dataset-specific one.
The longer trend is less ambiguous. The Defiant noted DEXs sat below 10% of CEX volume for most of 2024, then moved to between 18% and 21% through the first half of 2026. CoinGecko found the ratio had climbed from 6.9% in January 2024 to 13.6% in January 2026 on its own measure. Different methods, same direction.
The quarterly picture tells the same story
July was not a one-off blip. CoinGecko’s quarterly figures show the same pattern. Top-10 spot DEX volume fell from $556.4 billion in Q1 2026 to $408.9 billion in Q2, a drop of about 26.5%. Over the same stretch, the top-10 DEX-to-CEX ratio still rose to 23.5%, up 2.1 percentage points.
In other words, two quarters in a row, DEXs lost dollars and gained relative ground.
What the volume is made of
The July slump also shows what DEX trading looks like when the hype fades. Blockworks data showed stablecoin pairs made up about $31.5 billion, roughly 30%, of July’s DEX activity. Tokenized-equity volume on DEXs dropped to $1.4 billion from $3.56 billion in June, the second-highest month on record.
Concentration is also high. In the CoinDesk July data, Uniswap led with about $53.4 billion and PancakeSwap followed with about $18.5 billion. Together that is roughly 41% of the $176 billion total. Share gains happened in a smaller, top-heavy market.
Then volume came back, and the share held
This is the part that makes the story more interesting than a one-month quirk.
Spot trading recovered in September. TokenPost reported that CEXs handled $1.13 trillion in spot volume, up 27.3% on the month, while DEXs recorded $279 billion. That put DEXs at 19.8% of the combined total, or about 24.7% of CEX volume.
So when centralized volume bounced back, the DEX share did not collapse back to its old level. It stayed close to the July reading. Those September figures come from a different source than the July data above, so do not compare dollar amounts across the two. The useful point is the ratio: it held near one-fifth of combined spot volume through a rebound as well as a slump.
That matters, because the bear case on the July record was that it was a temporary denominator effect. CryptoSlate laid out a scenario where DEX share falls back to the mid-teens if centralized volume rebounds. September gives an early hint that the floor may be higher than that, though one month is not a trend.
What the stat does not say
A higher share does not mean DEXs now set the price of crypto. Kaiko’s director of research has said the vast majority of market activity still happens on centralized exchanges, which remain the main venue for price discovery. CryptoSlate made a similar point: centralized venues still lead on Bitcoin and major Ethereum pairs.
It also does not mean DEX demand surged. The July figure says the centralized market shrank faster than the onchain one, nothing more.
Why this matters
If you only track dollar volume, July looks like a bad month for DEXs. If you only track share, it looks like a triumph. The honest read sits in between: DEXs proved more resilient than centralized spot trading in a downturn, and they have kept a bigger slice since. Whether that slice grows depends on DEX liquidity, execution and users rising together, not on CEX volume falling.
Watch three numbers side by side: DEX volume in dollars, the DEX-to-CEX ratio, and the DEX share of combined volume. When all three rise, the shift is real. When only the ratio rises, it may just be someone else’s bad month.

Dan is a seasoned crypto writer for Blockchaindose who got his start in the space back in 2019. Over the past four years, he’s built a solid grasp of how the industry moves, focusing heavily on DeFi, NFTs, GameFi, and promising new projects.
Off the clock, you’ll usually find him buried in a good book or kicking back with a movie. His blend of hands-on market experience and straightforward commentary makes him a clear, trusted voice across the platform.