


In the last week of January 2026, a deep freeze hit the United States. The effect on BTC, especially Bitcoin mining was quick. The late-January Arctic blast cut the network’s 7-day average hashrate from 1,051 to 833 EH/s in a week. That is roughly 200 EH/s, gone in seven days.
That number matters because the popular story about Bitcoin’s 2026 mining slump is simple. Miners got squeezed, switched off old machines, and stopped spending. There is truth in that. But it is not the whole story, and the data shows why.
The peak everyone measures from
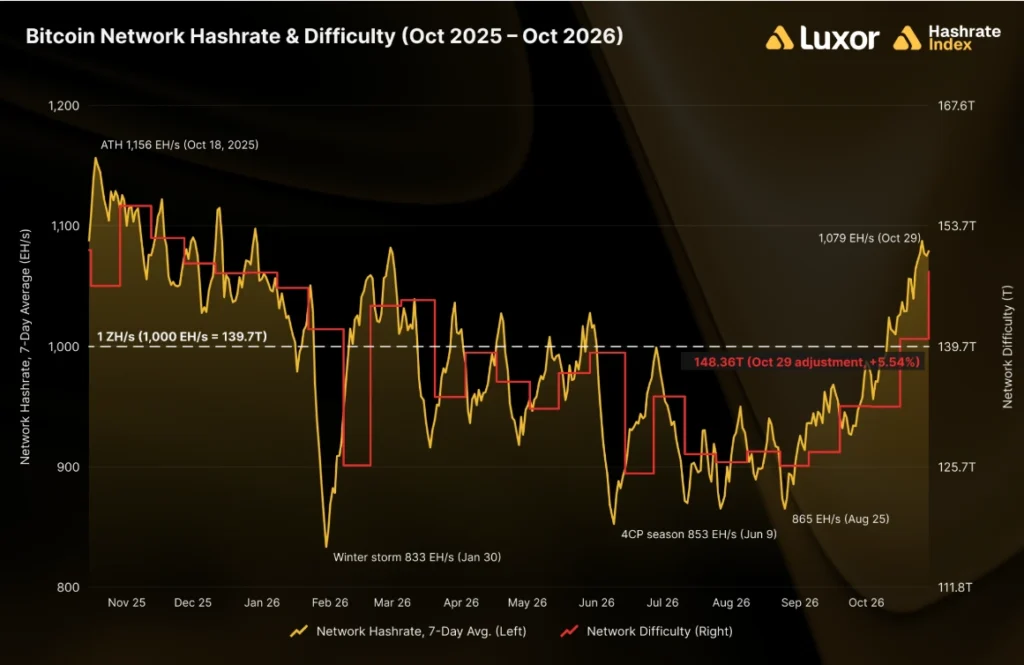
Start with the high-water mark. Hashrate peaked at 1,156 EH/s on a 7-day basis on October 18, 2025, and difficulty followed to a record 155.97T eleven days later. Bitcoin’s price had topped out just before that, at $124,485 on October 6, 2025.
From there, hashrate slid. By the Arctic week it was near 833 EH/s, about 28% below the peak by my math. The figure floating around, 850 EH/s, is close.
The hidden stat: weather, not just economics
The cold snap left clear marks on the difficulty chart. It produced the two largest adjustments of the year: −11.16% on February 7 and +14.73% on February 19, as curtailed loads came straight back.
So the February trough was a freeze followed by a snapback within about two weeks. It did not show miners deciding to stop investing. Weather explains the depth of the low, but it does not explain the whole decline.
So was it “capital discipline”?
Partly, and the evidence is real.
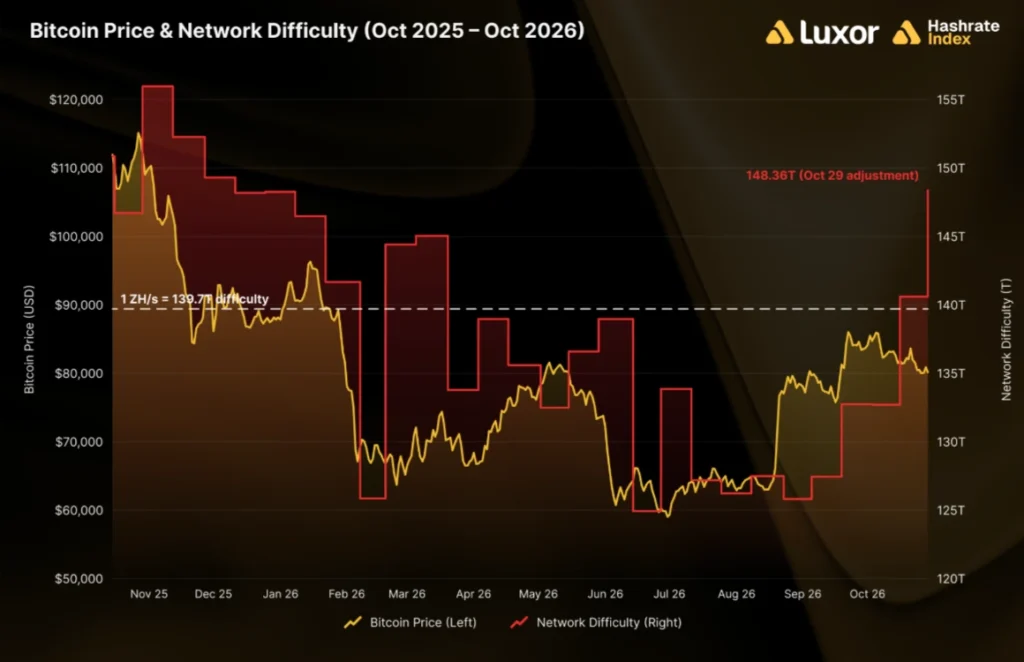
Price did hurt miners. Luxor’s Q4 2025 projections estimated that about 90 EH/s of marginal hashrate dropped offline due to the price decline, out of roughly 100 EH/s actually observed since mid-October. Later, Bitcoin fell to a cycle low of $59,005 by June 30, a 53% drawdown, and USD hashprice bottomed at $27.74 on June 6. Hashprice is what a miner earns per unit of computing power per day. It was $46 at the October 2025 hashrate high.
Glassnode’s indicator agreed. Its Hash Ribbon compares the 30-day and 60-day averages of hashrate. It last showed capitulation in late November 2025. By February, it was close to signaling the end of a three-month capitulation, one of the longest on record.
The long view is unusual too. By July, difficulty was down year over year for only the second time in Bitcoin’s history.
Where the simple story breaks
Two more forces were at work, and neither is about unprofitable machines.
The first is summer in Texas. Many miners there deliberately switch off during peak power demand to dodge transmission charges. Luxor calls this the 4CP season. The eight difficulty adjustments between June 14 and September 19 averaged −0.44%, and the June 14 adjustment alone was −10.09%. Across 2022 to 2026, June–September adjustments averaged +0.75%, against +1.90% in the other eight months.
That is a seasonal pattern, and it is a money-saving strategy rather than distress. One Luxor flexible-load client curtailed at all four peak intervals this year, and the avoided charge outweighed the bitcoin mining margin given up by roughly 14 to 1.
The second is that the network never really stayed down. Curtailed hashrate returned once the final peak passed on September 12, and the 7-day average rose from 926 to 975 EH/s across September.
So the contraction was a mix of price pain, a freak freeze and a built-in summer dip. “Capital discipline” explains only the first.
The rebound is bigger than the thesis allows
Here the original claim needs updating. The idea that the network recovered only “partially,” to around 968.5 EH/s, is now out of date.
The 7-day average hashrate crossed 1,000 EH/s on October 11 for the first time since June 1, and has held above it since. It reached 1,088 EH/s on October 26, its highest since December 29, 2025. That sits about 6% below the October 2025 peak, not 16%.
Difficulty tells the same story. Since the final Texas peak, it has risen a cumulative 16.4% over four adjustments, from 127.45T to 148.36T, about 5% below its record. Seasonal history points the same way. October has delivered positive difficulty growth every year since 2022, averaging +4.38% per epoch.
The number that complicates everything
The most interesting stat is a comparison. At about $80,150 on October 29, Bitcoin is 36% below its peak, while difficulty is 4.9% below its own.
Computing power came back much faster than price did. That squeezed margins. Hashprice has fallen to about $34 after the October 29 adjustment, against $46 at the all-time hashrate high.
Luxor’s reading is that the returning hashrate is cheaper to produce than what left. That is plausible, but it is their interpretation. Their own forward market suggests more strain ahead. It now prices difficulty to hold around current levels through year-end, with modest growth resuming in early 2027.
A caution on the data itself
Not every number online is reliable. Several small sites that appeared in my searches gave hashrate readings from 738 to over 1,250 EH/s for the same month, which can’t all be right. I excluded them. The figures above come from Luxor’s Hashrate Index and Glassnode. Providers also use different averaging windows, so expect small differences between sources.
Why this matters
Hashrate headlines are easy to over-read. A falling line can mean broke miners, bad weather or a seasonal power-bill strategy, and each has different consequences. Here, the network got stronger, but margins got thinner. Anyone judging miner health, or using hashrate as a signal for Bitcoin’s price, should check the cause before trusting the chart.

Dan is a seasoned crypto writer for Blockchaindose who got his start in the space back in 2019. Over the past four years, he’s built a solid grasp of how the industry moves, focusing heavily on DeFi, NFTs, GameFi, and promising new projects.
Off the clock, you’ll usually find him buried in a good book or kicking back with a movie. His blend of hands-on market experience and straightforward commentary makes him a clear, trusted voice across the platform.