The SAGA token has shown some interesting movements in recent days. Based on a technical analysis using key indicators such as support and resistance levels, moving averages, and the Relative Strength Index (RSI), there are insights worth noting that can help guide potential trading decisions.
Current Market Overview of SAGA
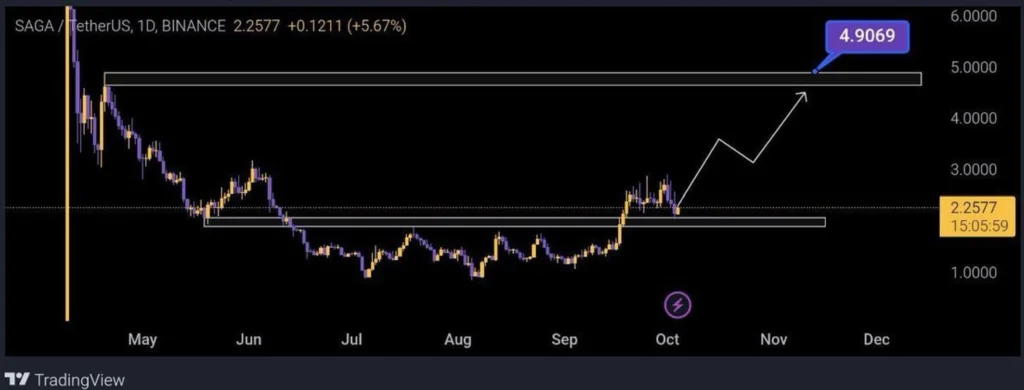
SAGA is currently trading at $2.25, showing a minor gain of 5.67%. This level sits close to a key support zone, which is crucial for determining upcoming price movements. Recent price action suggests that SAGA could be setting up for a larger move in the near term according to the latest SAGA analysis.
Key Support and Resistance Levels
- Support Level: A strong support level is forming around $2.00. This area has proven to be a solid floor for price bounces and corrections. This could be an entry point for bullish traders looking for a potential upward move, as identified in SAGA analysis reports.
- Resistance Levels: The next significant resistance to watch is $4.90. This level acts as a ceiling for price movements and will be an important hurdle to clear if the bullish momentum continues. Breaking this level could signal a further rise towards $5.50 or even $6.00.
Short-Term Outlook
SAGA might see some sideways trading between $2.00 and $3.00 in the short term, potentially building momentum for a breakout. A clear move above $3.00 could trigger a push towards the next resistance at $4.90.

Long-Term Outlook
Breaking through $4.90 opens up the possibility of a longer-term rally, with $5.50 to $6.00 as the next potential target. However, if the price fails to hold the $2.00 support, this could lead to a more bearish outlook, according to a detailed SAGA analysis.
Price Movement and Patterns
SAGA has been consolidating for a while, with a recent upward push in September, followed by a pullback. The chart indicates that the price is trading within a range, with $2.00 acting as strong support and $3.00 serving as an initial resistance before attempting a move toward $4.90. These findings are consistent with recent SAGA analysis data.
Moving Averages and RSI Analysis
Moving Averages (MA)
The moving averages are signaling mixed trends:
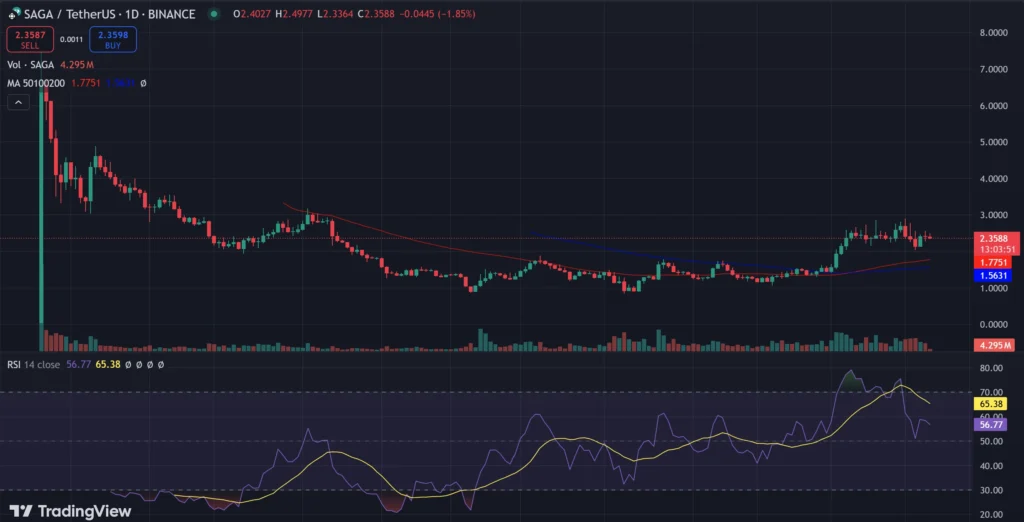
- 50-Day MA: Sitting around $1.77, the 50-day MA has acted as short-term support, indicating that upward momentum is holding for now. As long as the price stays above this line, the short-term outlook remains bullish.
- 200-Day MA: Positioned at $1.56, the 200-day MA is a long-term support level. The price is comfortably trading above both the 50-day and 200-day MAs, reinforcing the bullish trend for the time being.

Relative Strength Index (RSI)
- The RSI is currently at 65.38, nearing the overbought zone. While this suggests that buying pressure has been strong, it also indicates that SAGA might face some resistance soon if the RSI continues to climb above 70.
- Traders should keep an eye on the RSI for any signs of reversal. A retracement might be possible if the token becomes overbought, especially around the $4.90 resistance level. A cooling off period could lead to consolidation before another leg up.
Conclusion
SAGA’s price movement shows strong potential, especially if it can break the resistance at $3.00 and, later, $4.90. Moving averages and RSI are giving bullish signals, but the token is approaching overbought levels, which could lead to a short-term pullback or consolidation phase.
For those looking to trade SAGA, a break above $3.00 with strong volume could be the catalyst for a push toward $4.90 and beyond. However, caution should be exercised around key support and resistance levels to avoid getting caught in false breakouts or sudden reversals. Keep an eye on both the price action and technical indicators for further confirmation of market direction.
Risk management is key, so setting appropriate stop-losses and monitoring price levels closely will help navigate the upcoming market conditions.
Please note that this analysis is for informational purposes only. BlockchainDose does not provide financial advice, and we are not responsible for any investment decisions made based on this analysis. Always conduct your own research and consult with a financial advisor before making any trading or investment decisions.


