
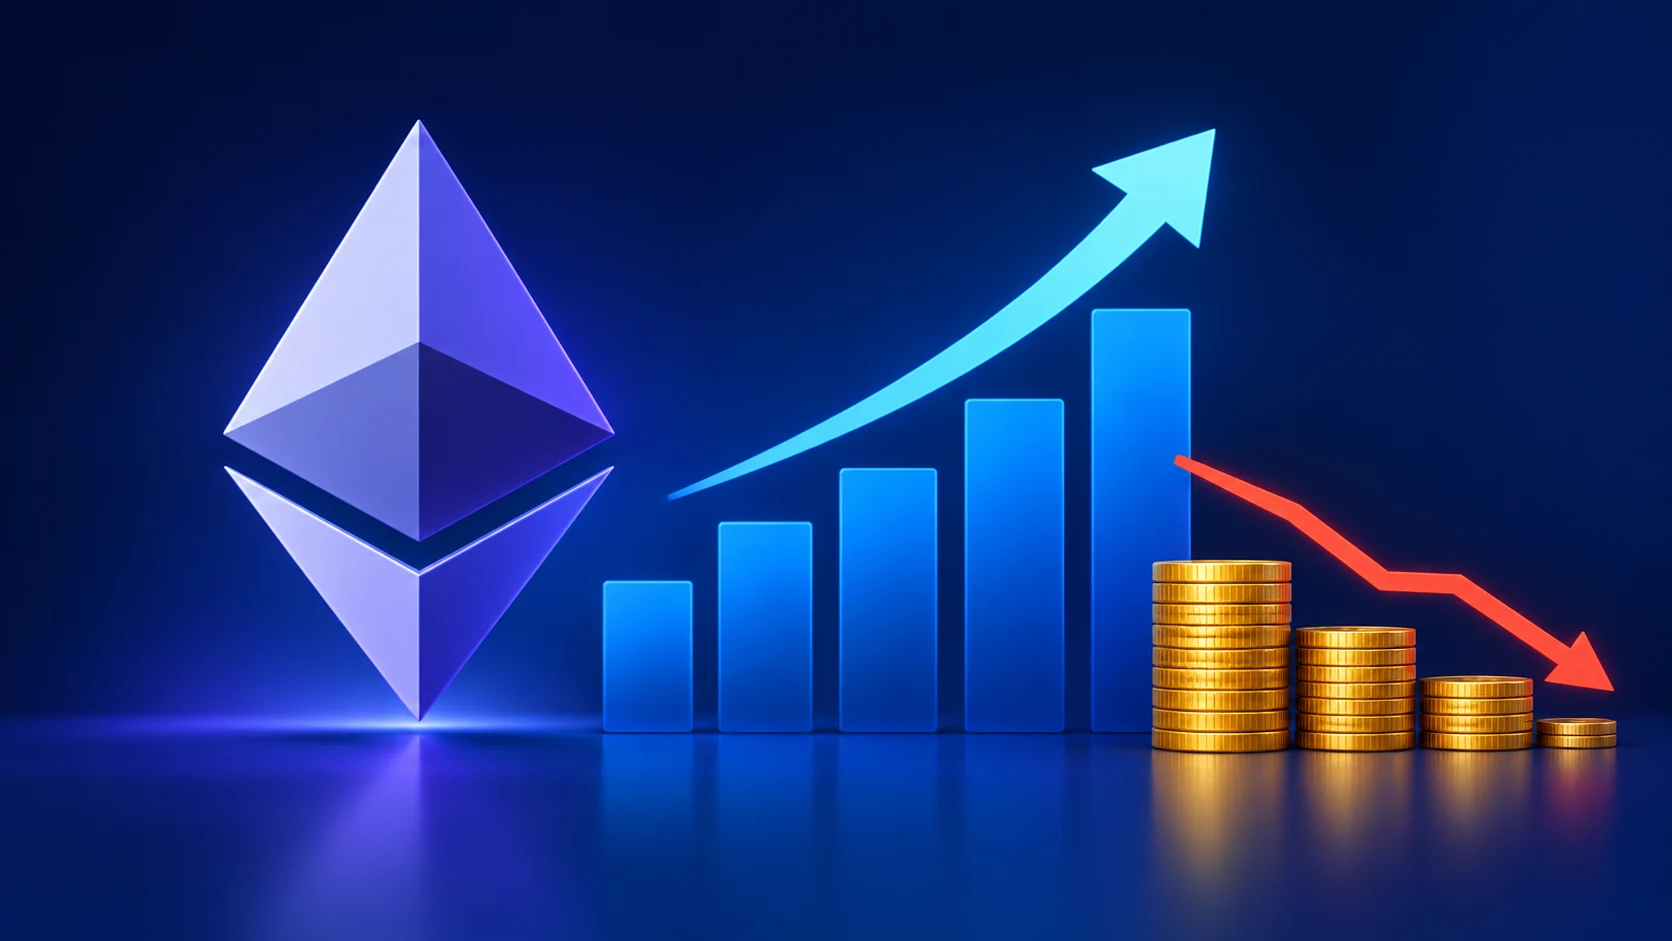
For most of crypto’s history, high Ethereum activity meant an expensive Ethereum. When people piled in during the 2021 NFT boom, the median transaction fee climbed above $25, according to Token Terminal data. Busy meant costly. Everyone just accepted it.
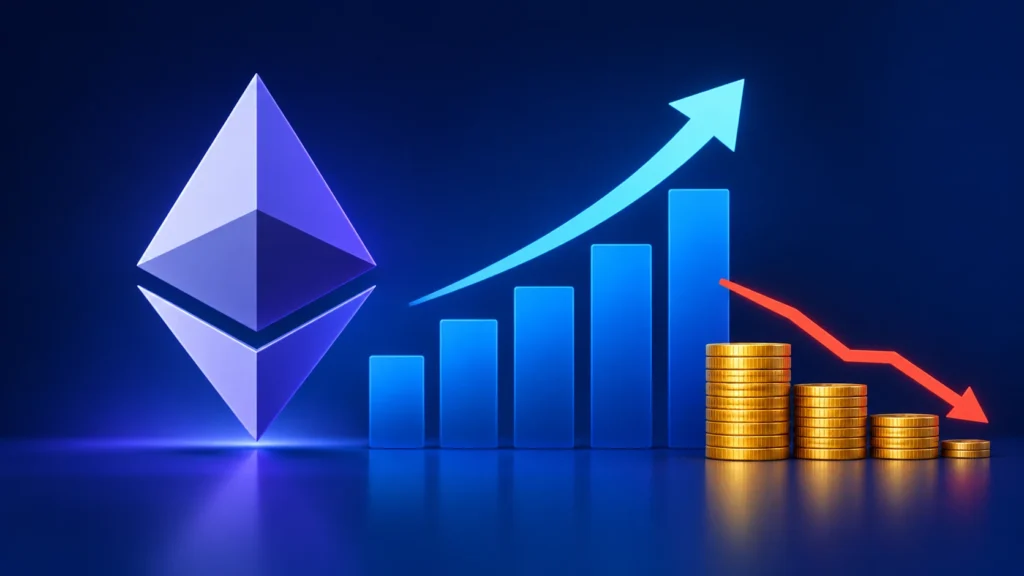
That rule no longer holds. In the second quarter of 2026, Ethereum’s base layer handled more transactions than it ever has, and users paid far less than they did a year ago. Hardly anyone is talking about the gap between those two lines. It is the real story of the quarter.
Ethereum Activity associated with Active Addresses
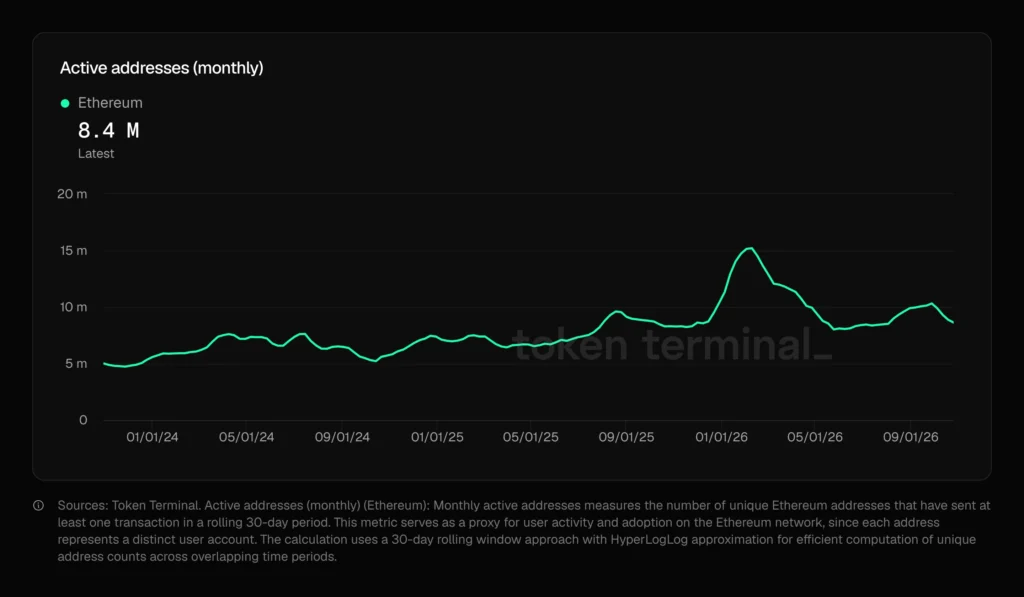
Start with usage. Token Terminal reports that Ethereum’s main chain processed a record 203.9 million transactions in Q2 2026, up 68.4% from a year earlier. Average throughput hit an all-time high of 25.9 transactions per second.
The network is also holding more value in more hands. Token Terminal counted 312.1 million ETH-holding addresses, up 27.4% from a year ago and another record. A record 32% of all ETH is now staked.
If you stopped reading here, you would assume fees must be booming too. They are not.
The hidden stat: fees did not keep up
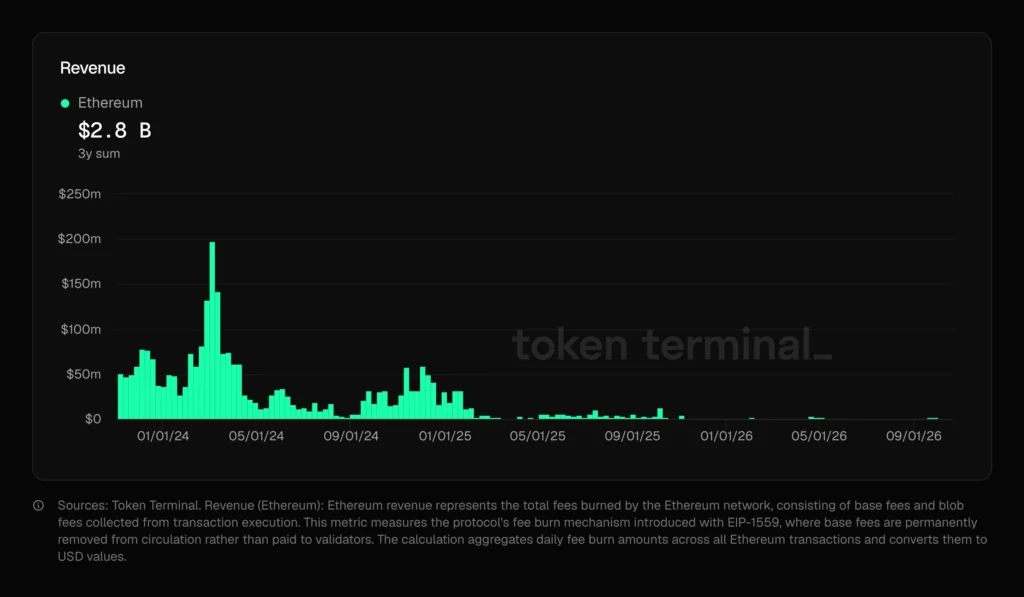
Ethereum earned $52.5 million in transaction fees in Q2. That sounds like a lot until you set it next to last year. Token Terminal’s figures put it about 49% below the same quarter in 2025.
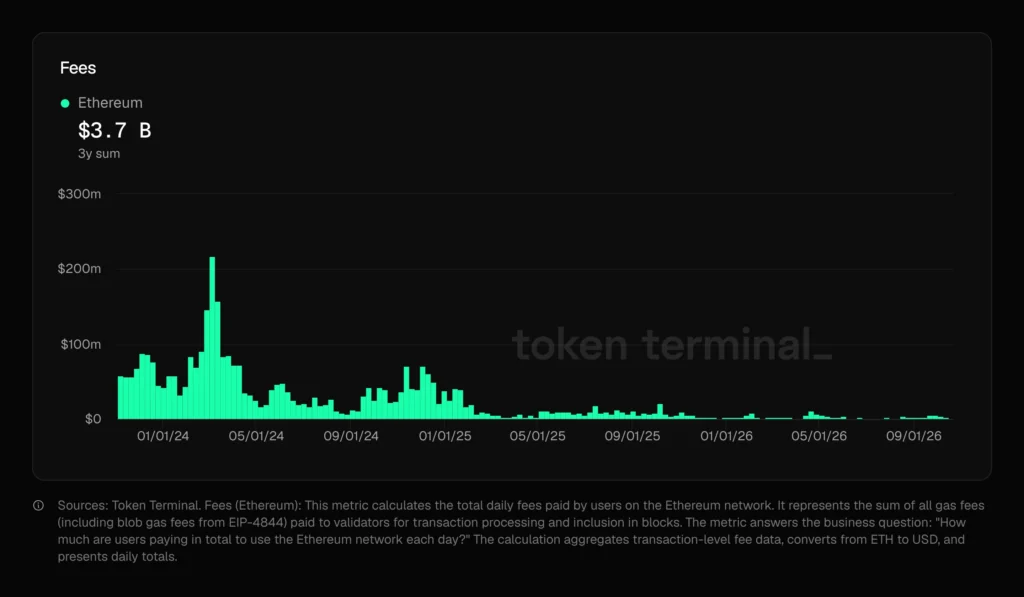
In plain terms: transactions are up roughly two-thirds, and fees are down roughly half. The network is doing much more work and collecting much less for it.
The first quarter tells the same story, only more sharply. Token Terminal’s Q1 report showed 200.4 million transactions (up 81.5% year over year) and L1 fees of $39.9 million, down 81.9%. Ethereum activity soared. Fees collapsed.
What users actually feel
This is not just an accounting quirk. You can see it at the checkout.
- The Block reported that average transaction costs fell to around $0.15 in gas, the lowest in Ethereum’s modern history, while daily transactions surged. Etherscan estimated a swap at about $0.04.
- AMBCrypto, citing Etherscan, said gas fees dropped to about $0.01 in January 2026, and that Ethereum processed a record 2.6 million transactions in a single day on January 17.
- Ethereum.org’s 2026 developer guide noted that Etherscan’s gas tracker showed standard gas near 0.15 gwei in early May, with April’s daily average around 0.5 gwei.
A few years ago, a day with 2.6 million transactions would have meant jammed blocks and bidding wars. Now it barely moves the price of a swap.
Does the claim hold up? Mostly, with one catch
Here is the honest check, because the numbers are easy to mix up.
Year over year, the claim is strong. Transactions rose 68.4%. Fees fell about 49%. Ethereum activity clearly recovered while fees did not.
Quarter over quarter, it flips. Compared with Q1, transactions grew only about 1.7% (from 200.4 million to 203.9 million). Fees grew 31.6%, from $39.9 million to $52.5 million. So in the short run, fees bounced back faster than ethereum activity.
The fair reading is this: fees hit a very low floor in Q1 and have started to climb off it, but they remain far below where they were a year ago. Activity set records without fees ever coming close to matching.
The burn figure is the sharpest sign of a rebound
Ethereum destroys part of every fee through a mechanism called EIP-1559. Token Terminal estimates the value of ETH burned reached $17.1 million in Q2, up from $8.1 million in Q1. That is a 112% jump.
It also changes the mix. In Q1, burned ETH was roughly one-fifth of fees. In Q2 it was roughly one-third. So demand for block space is picking up, even though the total fee pot is still small.
One counterpoint worth knowing
There is a reason to be careful before calling this a clean success story. Reporting on the same Token Terminal data shows Ethereum’s active users fell about 30% to 9.2 million in Q2, after hitting a record 13.2 million monthly users in Q1. The fully diluted market cap also shrank 14.8% over the quarter, to $247.2 billion.
So fewer people were on the network, yet they sent more transactions. Token Terminal’s read is that the transactions carry more economic weight, and that existing users became more active. Some of the volume is also non-speculative. Standard Chartered estimated early in 2026 that stablecoins make up as much as 40% of Ethereum transactions. That is steady, boring payment-style traffic, which is exactly what a cheap network attracts.
It also points to the likely driver of cheap fees. Upgrades that made data cheaper for Layer 2 networks, plus more room per block, let the chain take on more traffic without bidding wars. The cost of that success is that the base layer earns less from each transaction.
Why this matters
Two reasons, kept simple.
For users and builders: Ethereum is no longer priced out of everyday use. Payments, stablecoin transfers and small trades now make sense on the main chain.
For ETH holders: Fees fund the burn. If activity keeps growing while fees stay thin, ETH’s “ultra sound money” story gets harder to tell. The Q2 burn rebound is a first sign that demand can return. Watch whether it lasts.

Dan is a seasoned crypto writer for Blockchaindose who got his start in the space back in 2019. Over the past four years, he’s built a solid grasp of how the industry moves, focusing heavily on DeFi, NFTs, GameFi, and promising new projects.
Off the clock, you’ll usually find him buried in a good book or kicking back with a movie. His blend of hands-on market experience and straightforward commentary makes him a clear, trusted voice across the platform.