

Every few weeks, a new headline says stablecoins moved tens of trillions of dollars. The figure is real. The problem is what it measures.
BCG and Allium put gross stablecoin transfers at more than $62 trillion in 2025. After filtering out bots, trading, exchange routing and internal contract movements, they found only about $4.2 trillion that looks like real economic activity. That is roughly 7% of the total.
So the hidden stat is simple. Of every $100 that moves on-chain as a stablecoin transfer, about $7 survives a basic reality check. And the portion that is clearly a payment for something is much smaller than that.
Three studies, three starting points
Not every researcher starts from the same gross number. The spread itself tells you how messy the data is.
| Source | 2025 gross transfers | What it tells us |
| BCG and Allium | More than $62 trillion | Widest count, includes everything on-chain [1] |
| Artemis | About $33 trillion | Mid-range estimate [2] |
| BIS | About $28 trillion | Narrowest of the three [2] |
The studies disagree on the starting line, yet they land in the same place at the finish. Real payments came to about $350 billion to $550 billion (BCG), about $390 billion (McKinsey and Artemis), and roughly $375 billion to $394 billion of labelled payments in Allium’s own data.
Take the middle figure of $390 billion against the $62 trillion headline. That is about 0.6%. Under 1%.
Where the noise comes from
Why is the gap so large? Because a single payment on-chain can trigger many transfers, and a lot of transfers are not payments at all.
- Allium’s data shows raw on-chain volume averaging about $5.6 trillion a month, versus about $985 billion a month once filtered. The filtered number is about 18% of the raw one.
- Visa’s on-chain dashboard, built with Allium and Artemis, showed $75.7 trillion in total stablecoin volume over 12 months, against $12.9 trillion adjusted. That is about 17%.
- A BIS working paper looked at 593 million token transfer events inside 141 million Ethereum transactions in 2025. Nearly 60% of those events happened inside complex transactions, not simple wallet to wallet sends.
Three different teams, three different methods, and the same pattern. Roughly one dollar in five or six survives the filter.
The twist: “adjusted” is still not “payments”
Here is the part most articles skip. Filtering out the obvious noise does not leave you with payments. It leaves you with a smaller pile of mixed activity.
Look at how far apart the “adjusted” numbers sit:
- $4.2 trillion for 2025 (BCG and Allium, real economic activity).
- $11.6 trillion for 2025 (Allium, adjusted transfer volume).
- $12.9 trillion over 12 months to May 2026 (Visa dashboard, adjusted).
- About $26 trillion annualized (Artemis, settlement after removing obvious noise).
Now compare all of them with the payment estimates, which sit in the hundreds of billions. Adjusted volume still holds treasury moves, DeFi activity and large internal transfers.
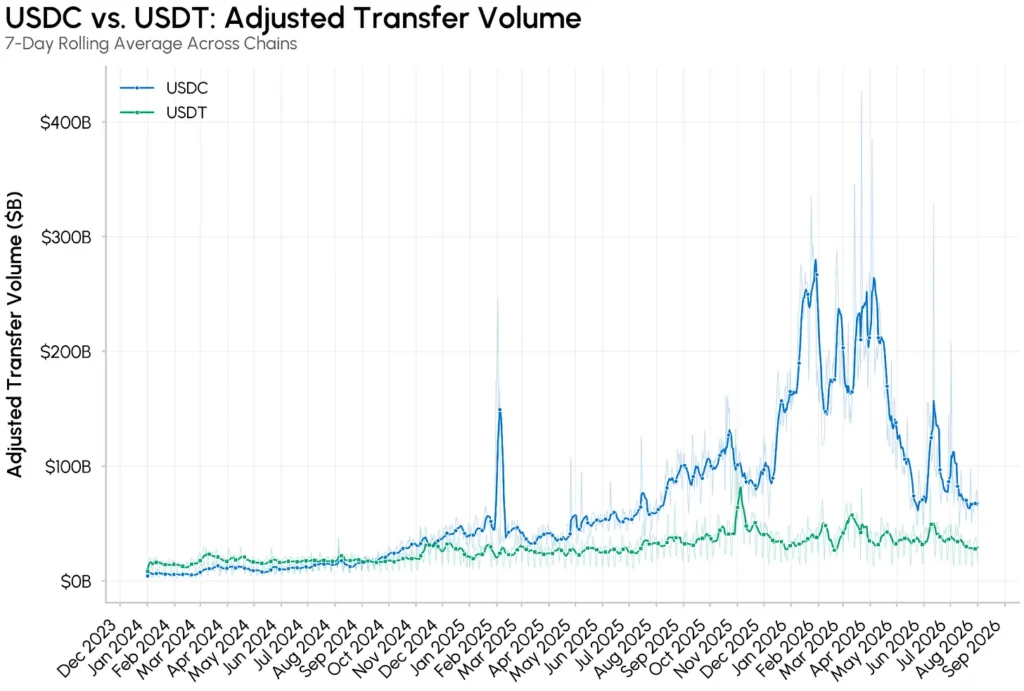
Coin Metrics shows the same split. Its adjusted stablecoin transfers topped $250 billion a day at points in 2026, while exchange trading volume was only about $18 billion a day. Year to date, adjusted settlement reached $41.7 trillion. Against that, the $401 billion of identified payments is roughly 1%.
Trading still runs the show
Stablecoins began as the cash leg of crypto trading, and the data says that role is still dominant.
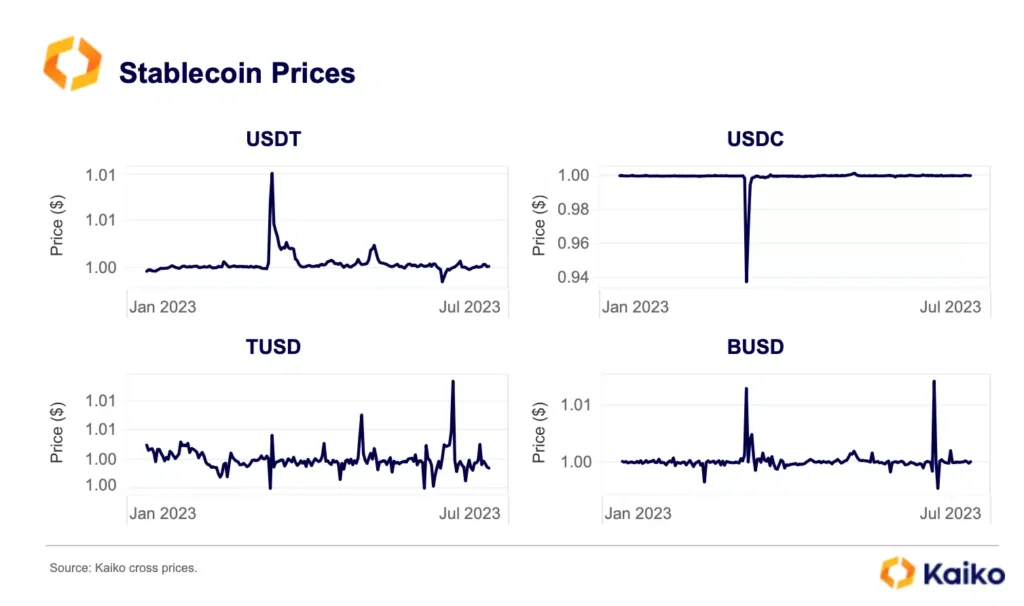
- Kaiko reports that 74% of centralized exchange crypto transactions involve a stablecoin.
- Tether holds about 70% of the stablecoin market share on centralized exchanges, and only about 5% of stablecoin trades happen on DEXs.
- In June 2026, Visa’s dashboard recorded a record $1.79 trillion of adjusted volume, up 63% from May’s $1.1 trillion. USDC made up about 67% of it, and the Base network handled about $565 billion, or 31.5%.
- Coin Metrics attributes about $32 trillion of 2026 adjusted transfers to USDC (77%) versus $8 trillion for USDT (19%), even though USDT has the larger market cap.
That last point is a useful warning. The biggest stablecoin by supply is not the biggest by activity, because activity is shaped by trading venues, bots and routing rather than by shoppers and employers.
The real payments: small, but growing fast
None of this means stablecoin payments are a myth. The small core is growing quickly.
- Allium counts at least $401 billion of identified payments in the first eight months of 2026, up 42% year over year, with an upper estimate of $527 billion.
- January 2026 alone recorded $44.7 billion in payment volume.
- BCG estimated 2025 real-economy payments grew about 60% on the year before.
- Adjusted volume rose about 317% since January 2024, while supply roughly doubled to $266.3 billion by February 2026.
- Stablecoin velocity, adjusted volume divided by supply, rose from about 2.6x to nearly 6x.
- Artemis counts roughly 10 million addresses making a stablecoin transaction each day, and more than 150 million holding a balance.
Who is paying? Mostly businesses. Companies receive 58% to 64% of identified stablecoin payments, and B2B payments carry an average fee of just 0.19%, compared with 0.95% for consumer to consumer transfers. McKinsey puts B2B at about $226 billion, around 60% of measured payments.
Still, scale matters. McKinsey and Artemis put real stablecoin payments at about 0.02% of global payments volume. And stablecoins make up only about 0.31% of the $44.3 trillion retail cross-border payments market, up from 0.2% in 2024. The “stablecoins replace SWIFT” story is early.
Why this data matters
If you read stablecoin news, you will keep seeing the big number. Knowing the small one protects you in three ways. You can spot inflated adoption claims. You can judge projects by payment volume, not transfer volume. And you can see the real story: a payments rail still in its first chapter, growing fast from a low base.

Dan is a seasoned crypto writer for Blockchaindose who got his start in the space back in 2019. Over the past four years, he’s built a solid grasp of how the industry moves, focusing heavily on DeFi, NFTs, GameFi, and promising new projects.
Off the clock, you’ll usually find him buried in a good book or kicking back with a movie. His blend of hands-on market experience and straightforward commentary makes him a clear, trusted voice across the platform.