
Between September 15 and 21, the price of Bitcoin jumped 14.6%, from $75,585 to $86,595. It touched $87,397 on September 21, the same day spot ETFs took in almost $1 billion. Fear-and-greed gauges flashed their greediest reading in more than a year, and headlines turned bullish.
But a less-noticed number sits underneath the rally, and it tells a more cautious story.
The number nobody put in the headline
It’s called the spot-to-futures volume ratio. It compares two ways of trading Bitcoin.
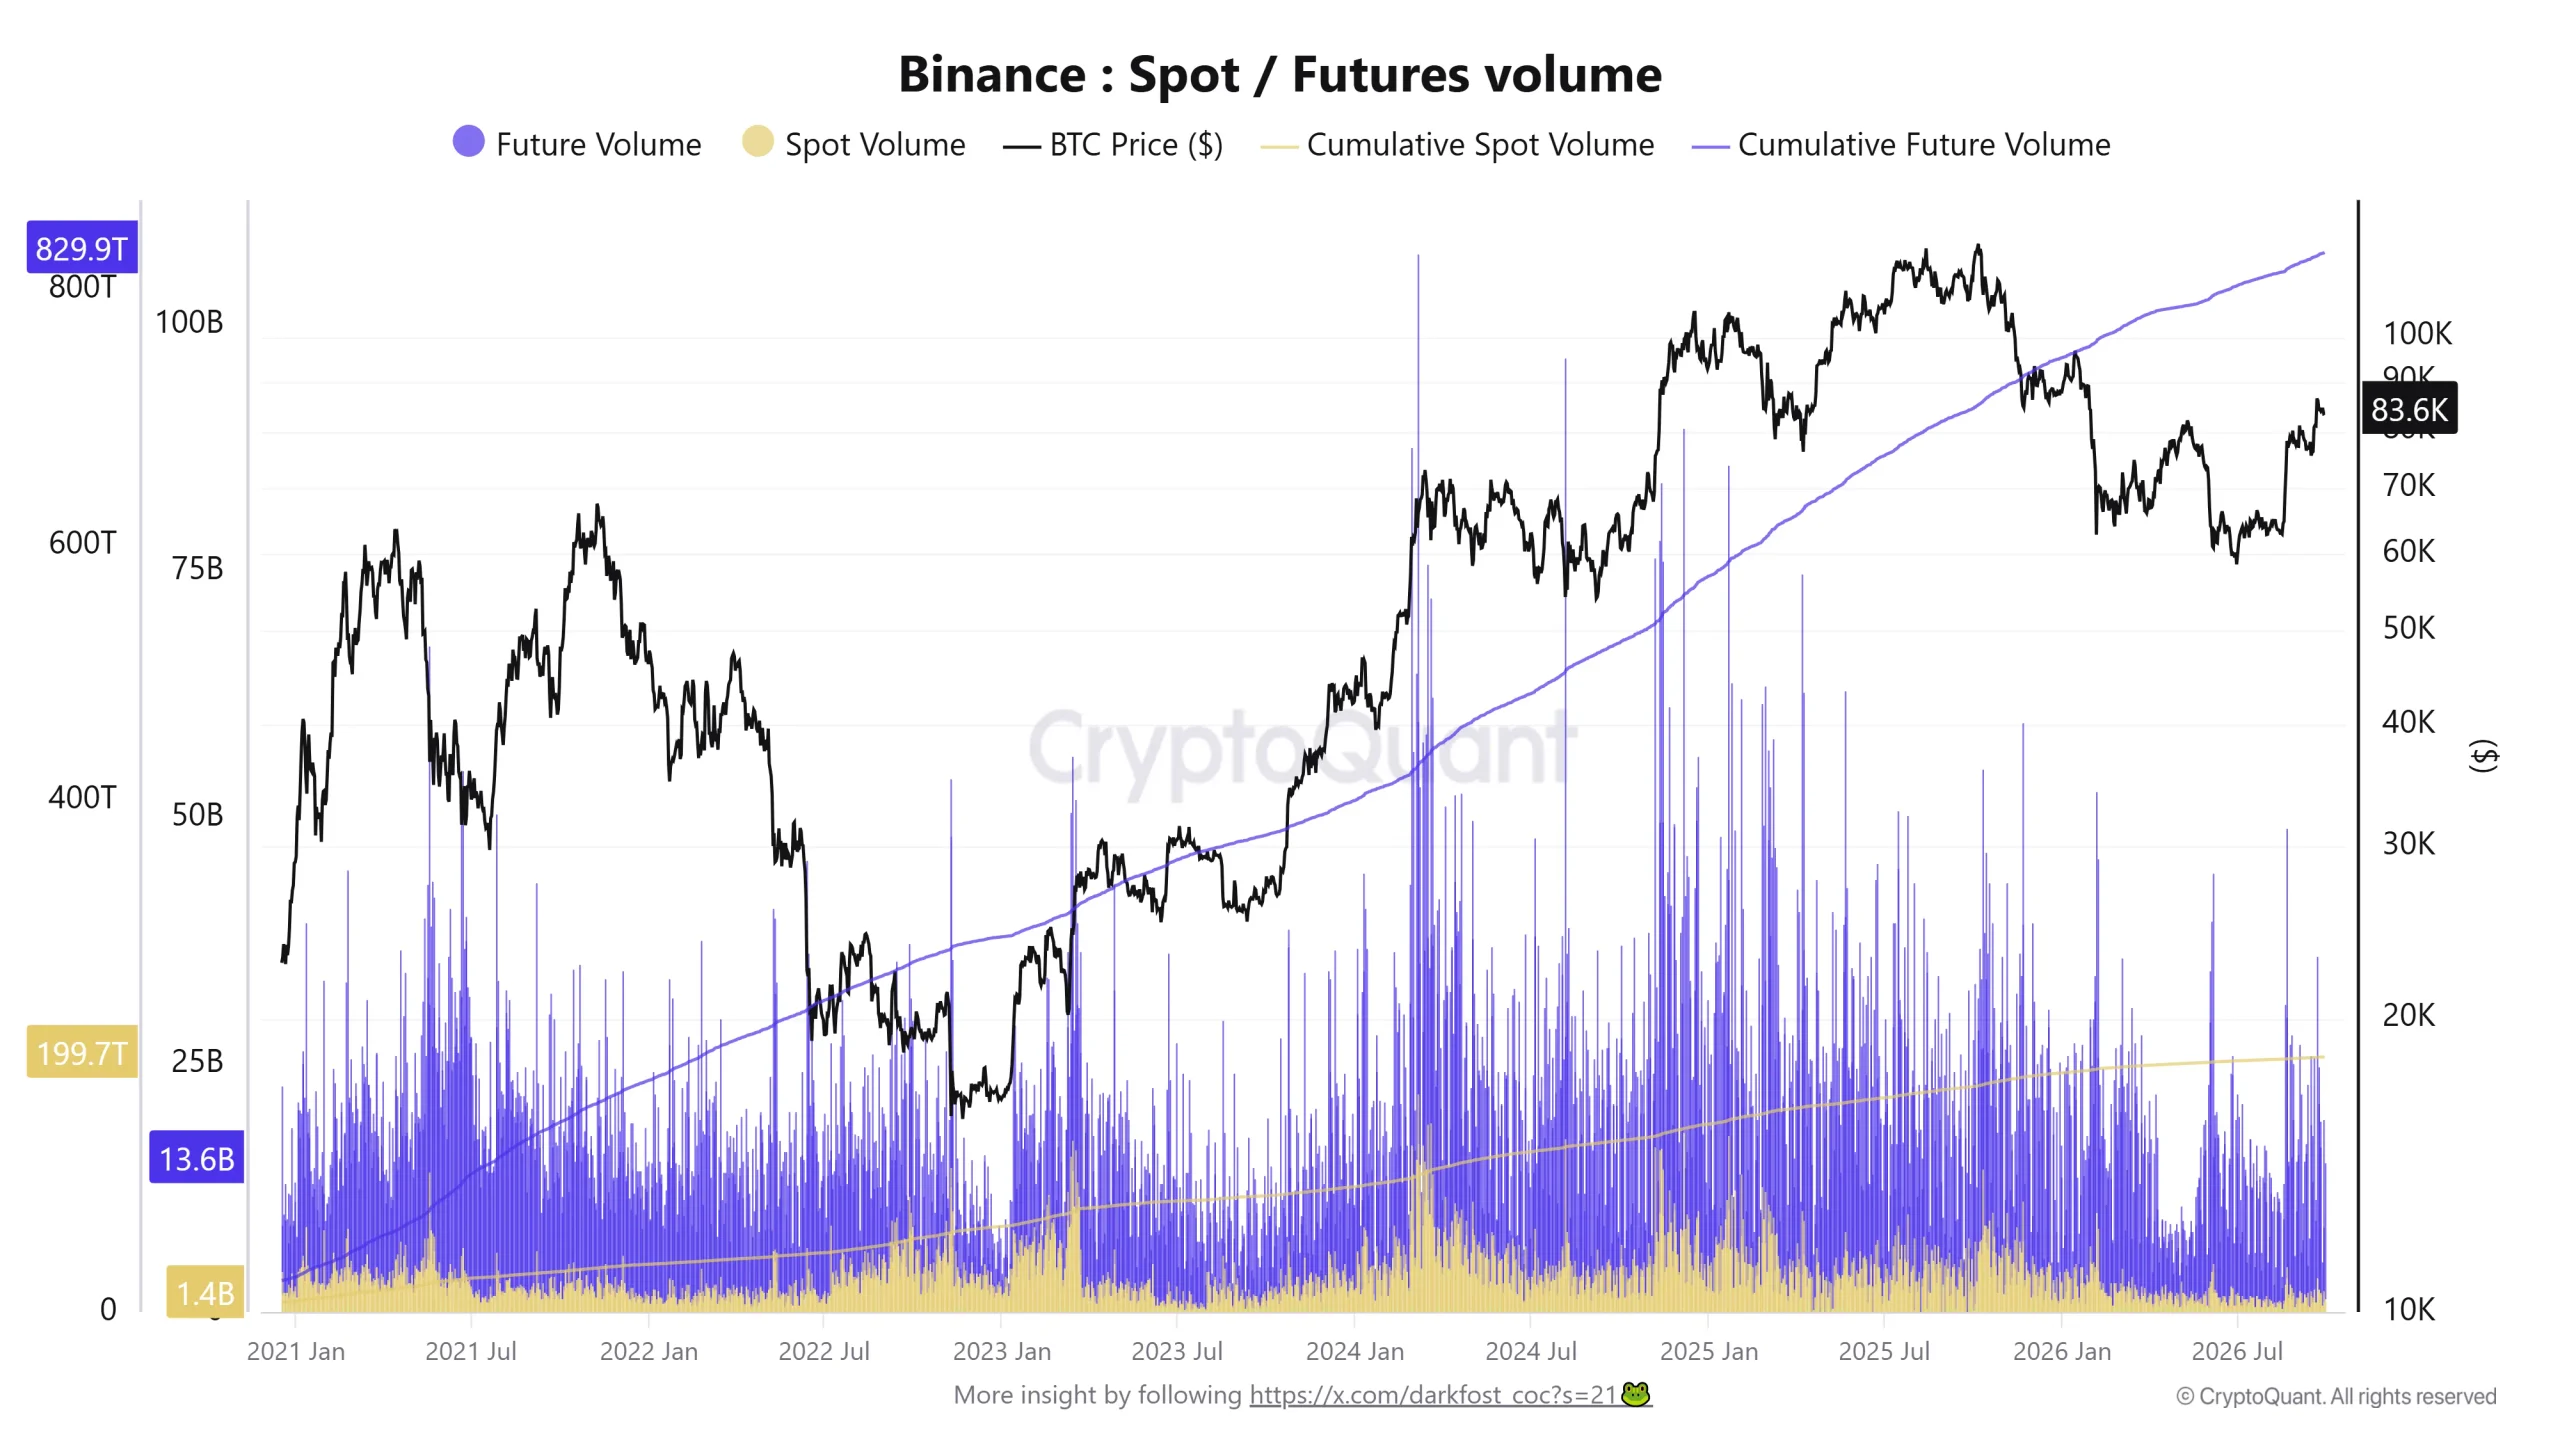
Spot trading means buying actual Bitcoin. Futures trading means betting on where the price will go, often with borrowed money, without ever owning the coin.
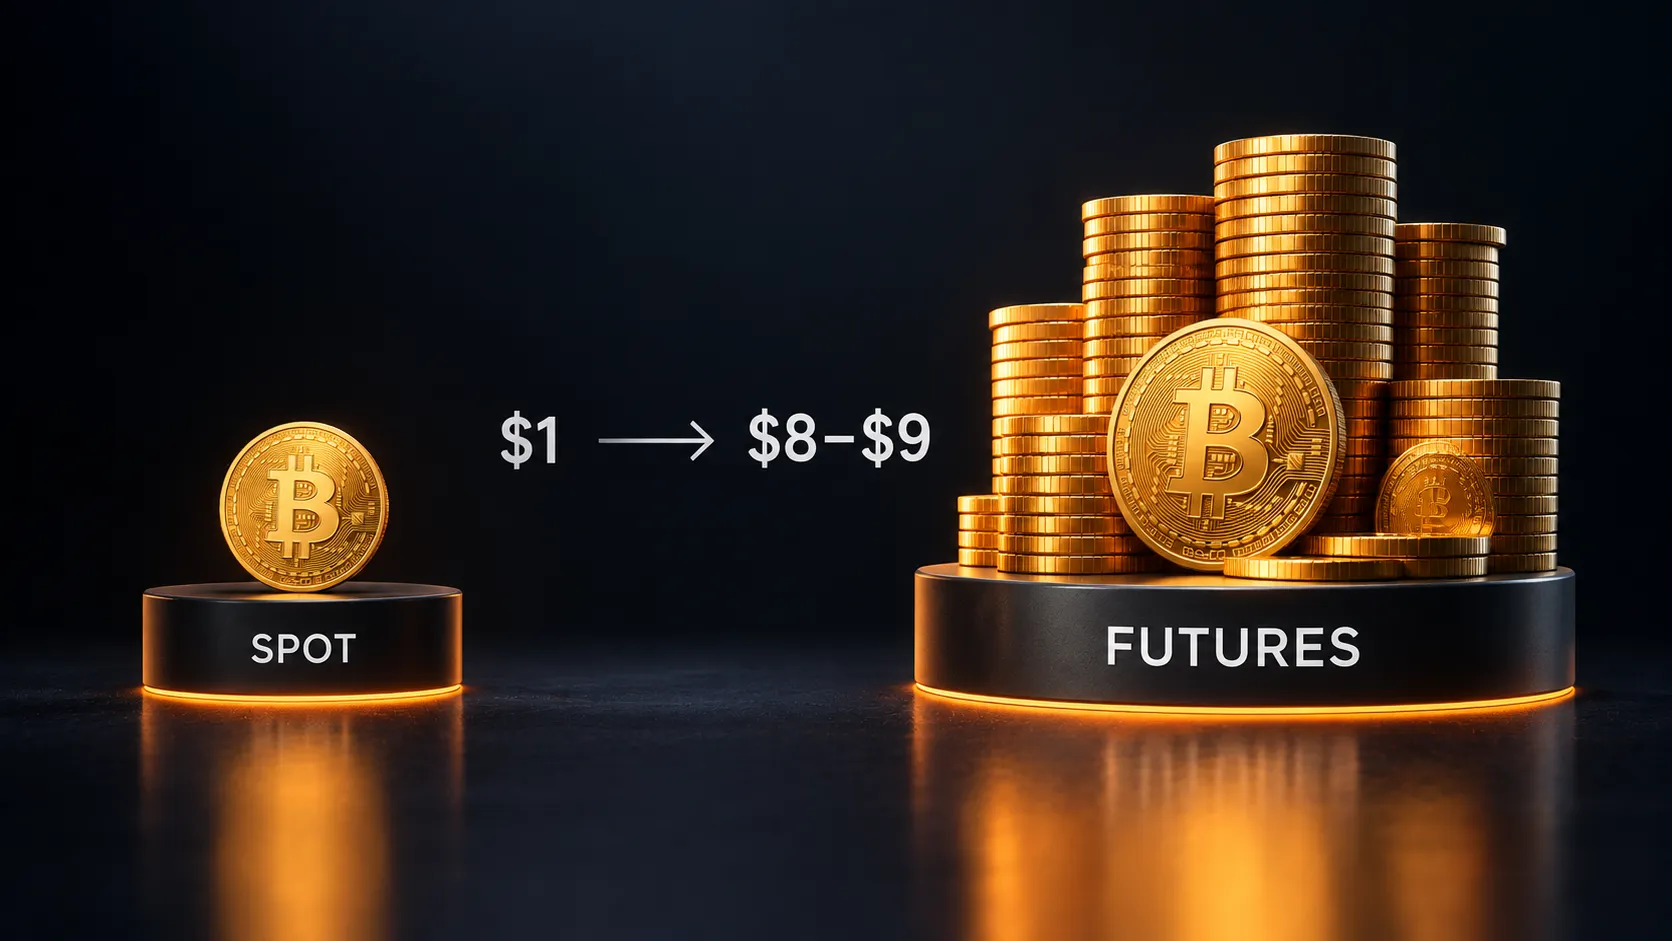
On Binance, the world’s largest exchange, CryptoQuant puts that ratio at about 0.12. That means roughly 90% of combined trading activity is in futures. For every dollar traded in spot, about $8 to $9 changes hands in derivatives.
Think of a farmers’ market where one stall sells actual tomatoes and nine stalls trade paper contracts on what tomatoes will cost next month. The price of tomatoes is still set at that market. But it is mostly being set by people who never take any home.
Is this actually new? Partly no.
It would be unfair to call this a sudden alarm. Futures have always out-traded spot.
CoinDesk Data’s review of late last year found derivatives made up 72.5% of centralized exchange volume, which was the lowest share since February 2025. So even the “low” readings were futures-heavy. The imbalance is a feature of modern crypto, not a bug that appeared this month.
What is notable is how stretched it has become, and how little the rally has changed it.
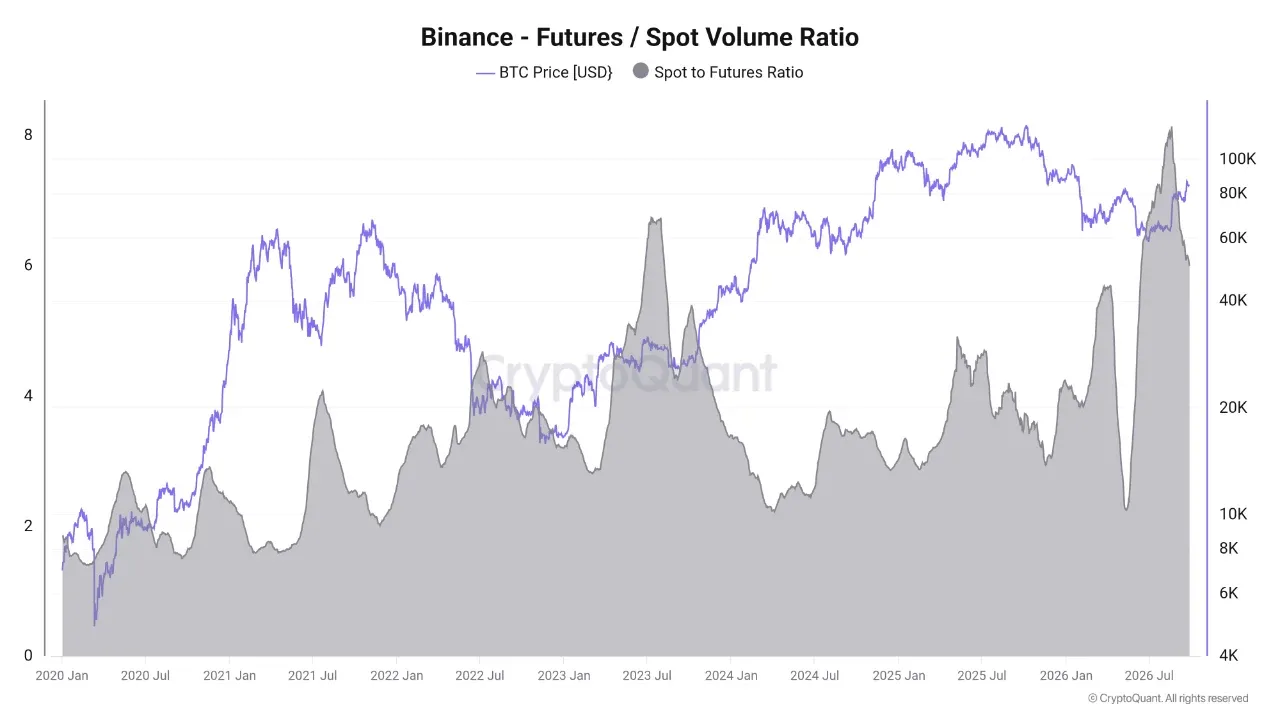
In early August, CryptoQuant reported a record futures-to-spot ratio of 7.82 on Binance, with Bitcoin trading near $64,000. Today’s 0.12 reading works out to roughly 8.3 times, which is the same extreme neighborhood. (The two figures are measured over different windows, so they can’t be compared exactly.)
That is the hidden part. Bitcoin rose roughly $20,000 and the imbalance barely moved. The rally did not bring in a wave of cash buyers.
The case against the worry: real money did show up
This is where the thesis gets tested. If spot demand were truly dead, we wouldn’t see the following.
- U.S. spot Bitcoin ETFs took in $998.96 million on September 21, the biggest single day of 2026.
- The week ending September 26 brought in $2.39 billion, the best week of the year, with seven straight days of inflows.
- That flipped ETF flows positive for 2026, after they sat roughly $5.8 billion in the red in mid-July.
- About $2.52 billion worth of BTC left major exchanges between September 22 and 24, a move that usually signals coins heading to long-term storage.
- Wallets holding 100 to 1,000 BTC have added 113,950 BTC since July 15.
So spot demand isn’t zero. Big, patient buyers are clearly there.
The case for the worry: the buying is already cooling
Look at what came next. Daily ETF inflows slid from $715 million to $347 million, then $191 million, then $134 million over the following four sessions. By September 28 they had dropped to just $31 million, a fall of about 97% from the peak.
Zoom out and the picture is thinner than the weekly headline suggests.
- CryptoQuant estimates apparent spot demand shrank by about 170,000 BTC over 30 days.
- Exchange trading volume is about 30% below where it was at the start of the year.
- ETFs had bought only about 18,000 BTC in September as of River’s September 23 report.
In other words, a few strong days of spot buying landed in a market where the broader appetite is weak.
The fuel behind the rally is running low too
You might think futures traders are carrying the rally on their own. That engine is sputtering as well.
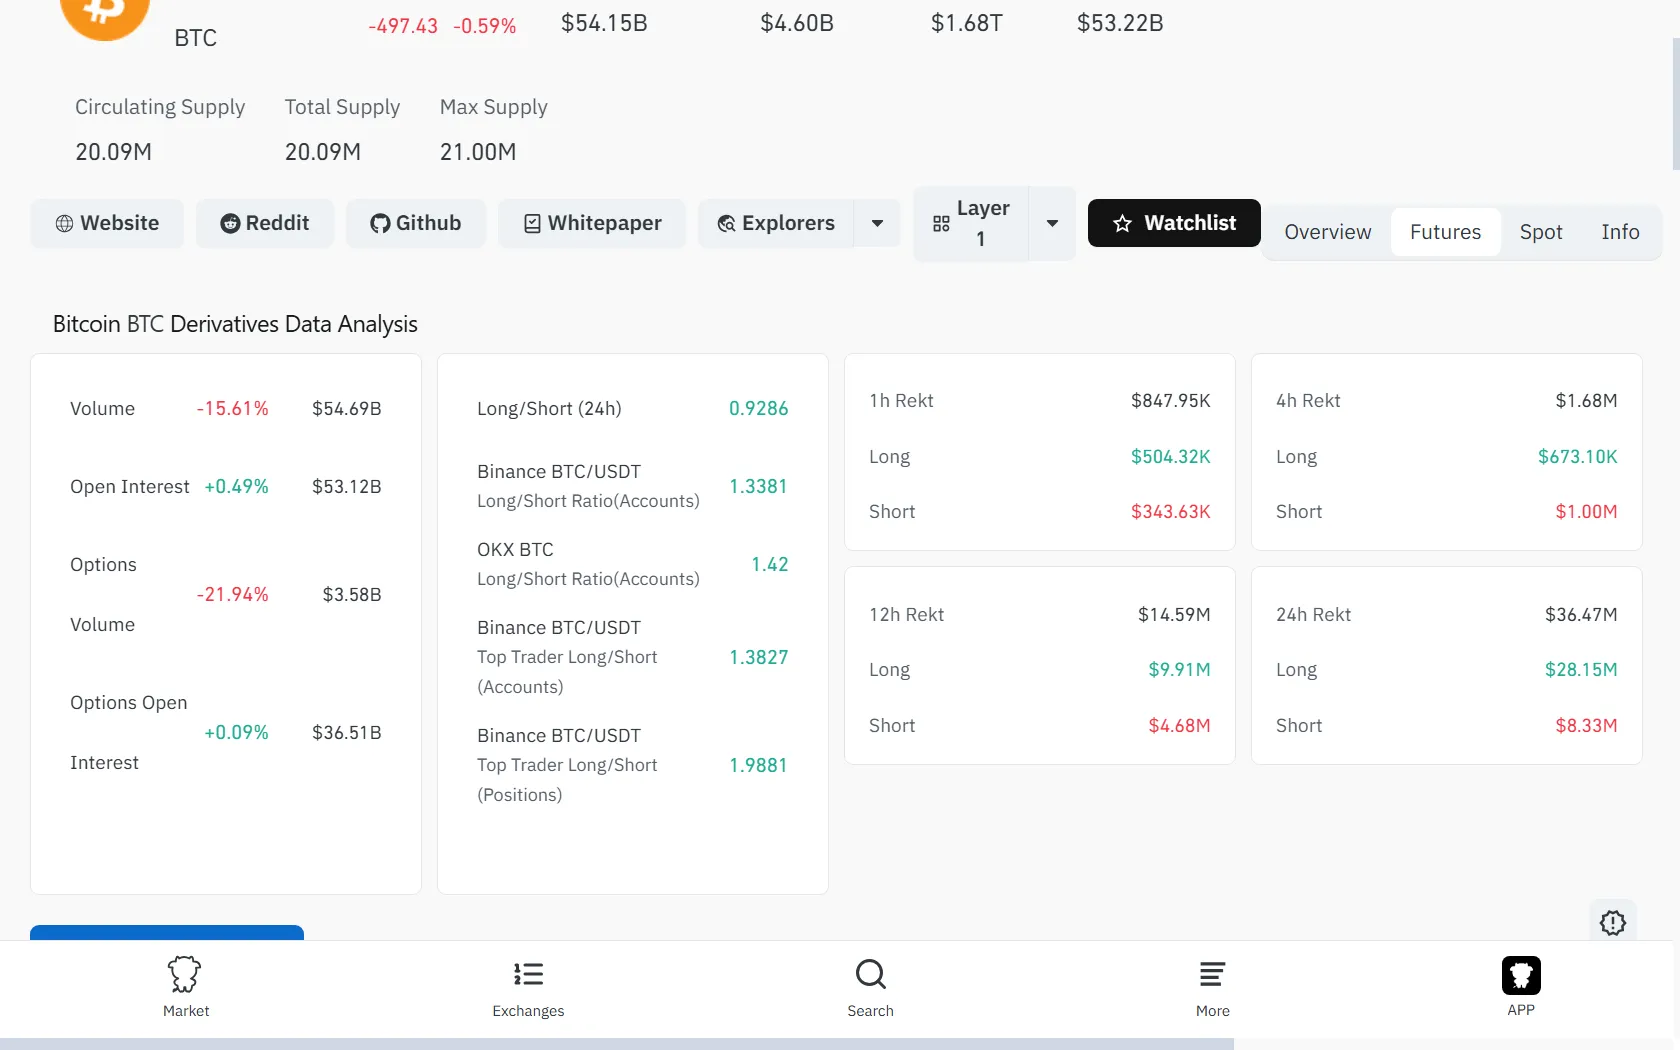
CryptoQuant says growth in futures demand fell to about 16,000 BTC from 164,000 BTC on September 14. Binance open interest, the total value of bets still open, dropped from $10.6 billion to $9.2 billion in a week. That is about 13%. Glassnode and Coinglass data shows Bitcoin open interest, measured in coins, down nearly 20% to its lowest since March.
Much of the climb came from a short squeeze. Traders betting against Bitcoin were forced to buy it back as the price rose. That wiped out $262 million in short positions during the ETF week. Alphractal says the largest short clusters have now been cleared. The biggest remaining pile of leveraged bets sits on the long side, below the current price.
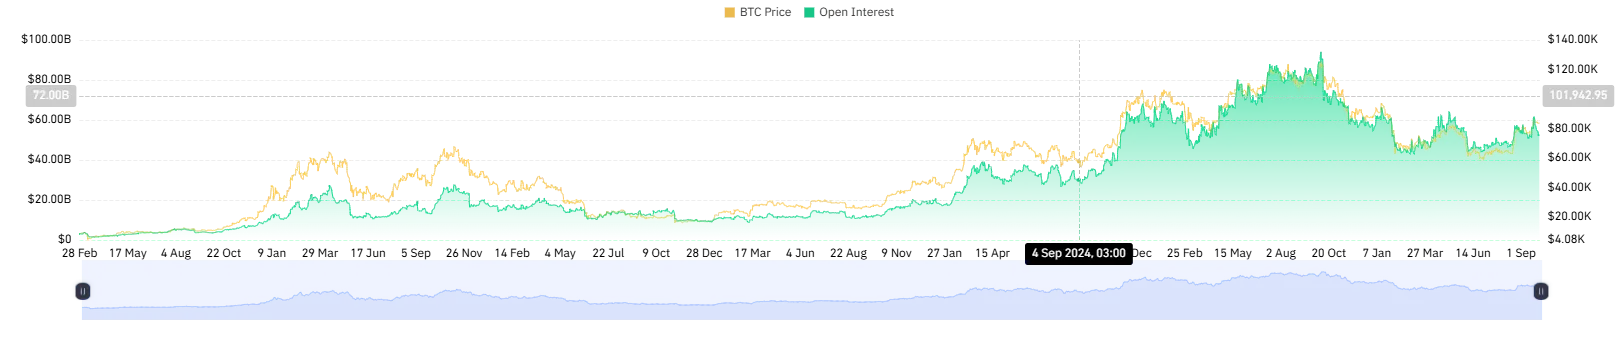
Shorts are still getting caught here and there. Reports citing CoinGlass say $82.61 million of shorts were liquidated in a single hour on September 30, though those figures are unconfirmed. But the big, one-time source of forced buying looks mostly spent.
Holders are cashing in
Meanwhile, sellers are getting more comfortable. Holders realized profits on 25,700 BTC on September 22, the largest single day of 2026. Short-term holders are sitting on an unrealized profit margin of 33%, the highest since December 2024. That is a lot of gains available to be sold.
What this does not prove
The data does not say Bitcoin must fall. Futures can lead a rally, and speculation often arrives before spot buyers do.
Volume is also not the same as money invested. Futures contracts are traded over and over, so $9 of futures volume is not $9 of fresh capital. The ratio also differs by source. Binance reads 0.12, and the supplied research notes put Glassnode’s all-exchange figure at about 0.17, which I couldn’t independently confirm. The direction is consistent across sources, even though the exact number is not.
Why you should care
This ratio is a quality check on a rally. A price move backed by people buying and holding coins tends to last. A move driven mostly by leveraged bets can reverse fast when those bets unwind.
Right now Bitcoin has some of both. The next test is clear. The 365-day moving average near $80,000 is the first major support, with the 200-day near $71,000 and traders’ realized price around $67,000 below that. If spot buying returns, the ratio should improve. If not, the rally leans on a thin base.

Dan is a seasoned crypto writer for Blockchaindose who got his start in the space back in 2019. Over the past four years, he’s built a solid grasp of how the industry moves, focusing heavily on DeFi, NFTs, GameFi, and promising new projects.
Off the clock, you’ll usually find him buried in a good book or kicking back with a movie. His blend of hands-on market experience and straightforward commentary makes him a clear, trusted voice across the platform.