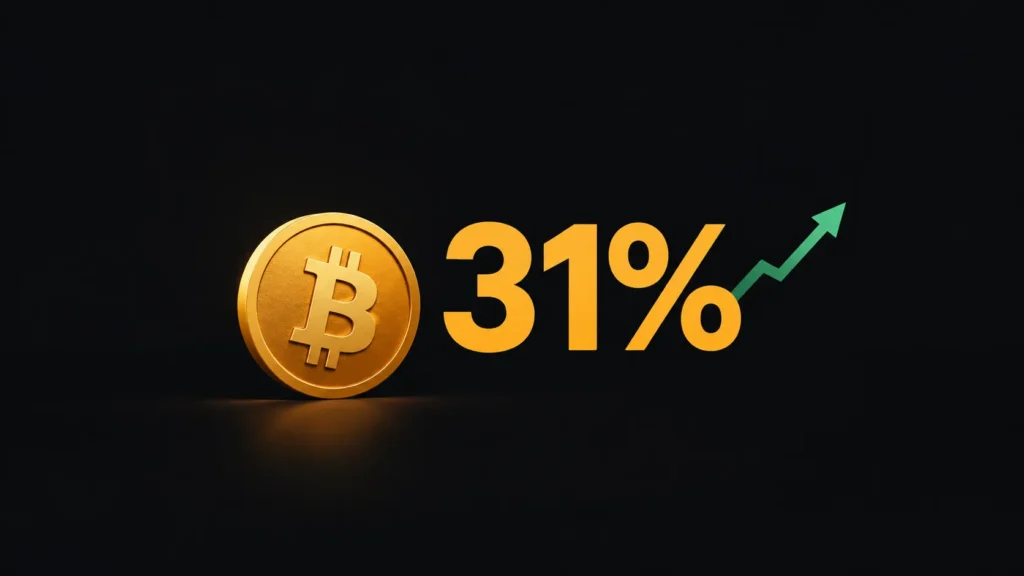
Deep in a CryptoQuant chart sits a line most traders never see, the 200-day average of Binance’s “Taker Buy/Sell Ratio. Interestingly, it has just done something it hasn’t done in years. It climbed from about 0.973 in February to 1.012. That moved it from a market led by sellers to one where aggressive Binance buyers have held a small edge for most of a year. CryptoQuant says the reading is approaching its summer 2020 high and sits above the level from the 2022–23 recovery.
That sounds like the start of a bull run, but the story is more complicated, and the complications are worth understanding.
What the stat actually measures
Every trade has an impatient side. A “taker” is the person who doesn’t wait for a better price. A taker buyer pays the seller’s asking price. A taker seller accepts the buyer’s bid.
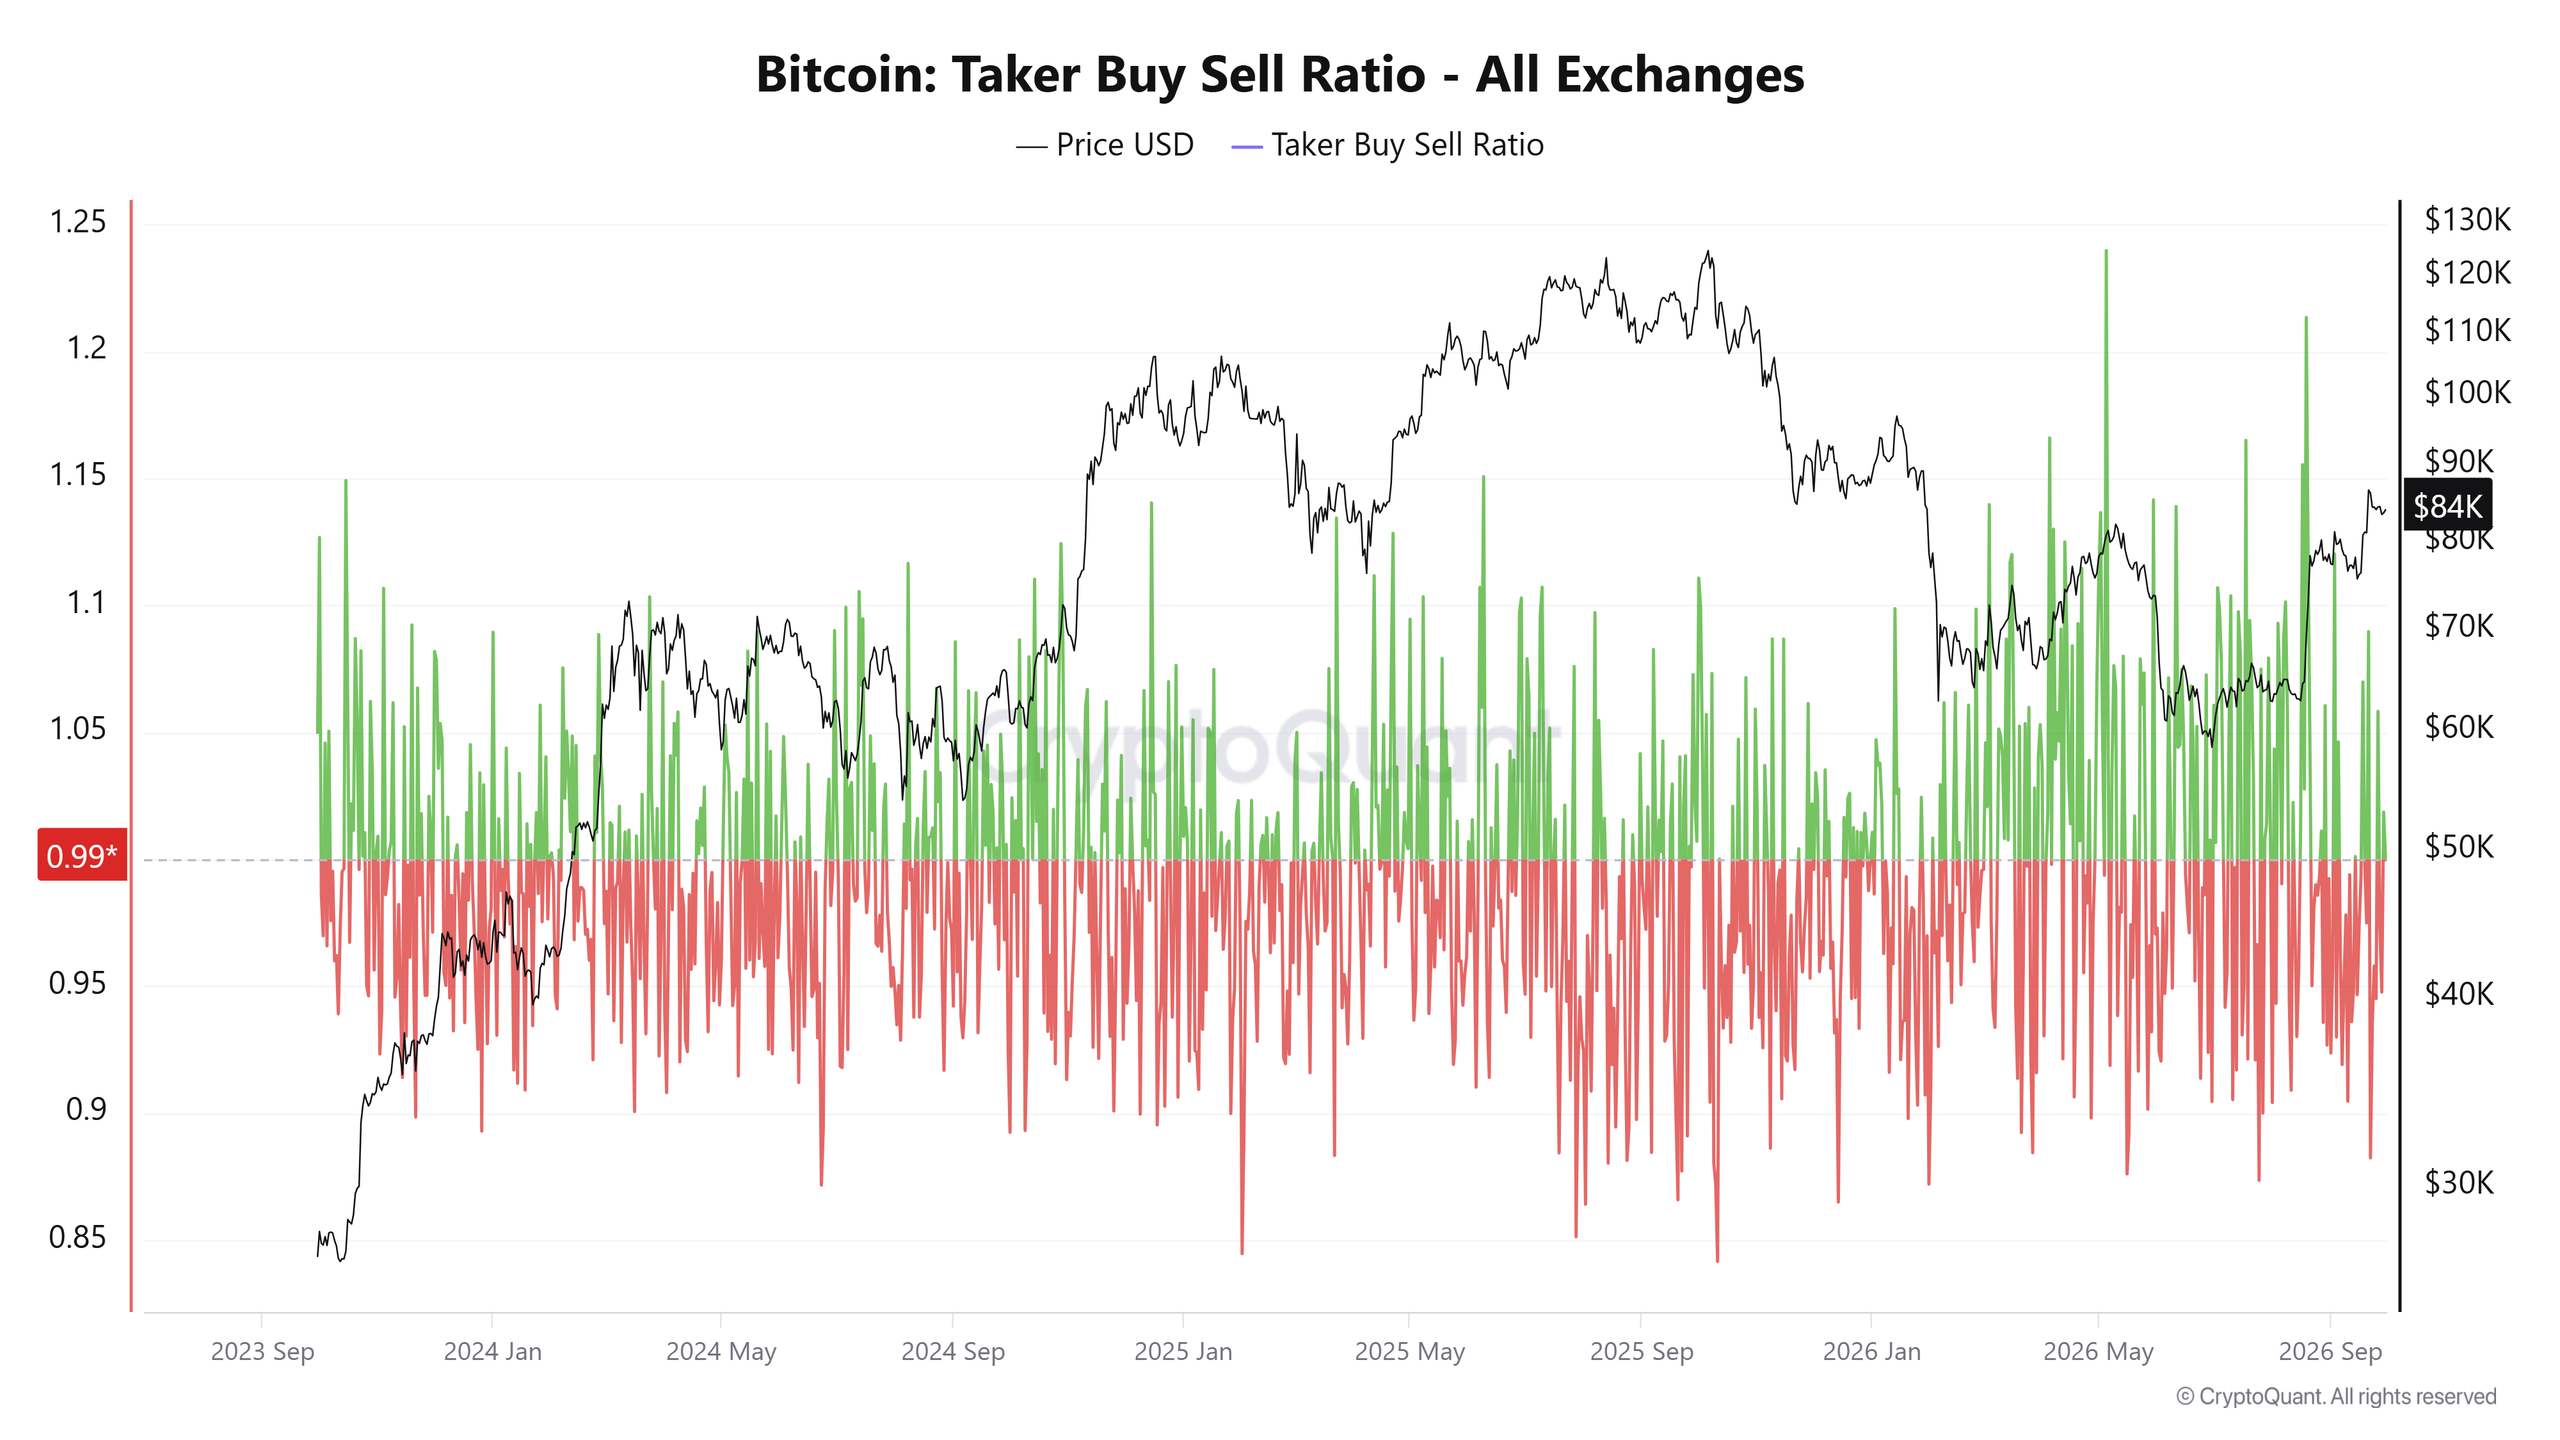
CryptoQuant’s ratio divides taker buying by taker selling, calculated from perpetual swap trades on each exchange. Above 1 means the impatient buyers are winning. Below 1 means the impatient sellers are.
The 200-day average smooths out the daily noise. That is its strength, because it takes a long time to move. It is also its weakness, as the next sections show.
The comeback is real. Binance buyers coming?
The turnaround is sharp when you look at where the ratio was a year ago. In August 2025, analyst Darkfost flagged the ratio slipping to around 0.95, its lowest level of the cycle on Binance. The same source noted that similar dips in July 2023 (0.97) and April 2024 (0.963) came before notable Bitcoin rebounds.
So the market went from a cycle low near 0.95 to an average above 1.0 in about a year.
Other Binance signals lean the same way. One is funding rates, the fee that traders on one side of a futures bet pay the other. CryptoQuant data showed the 50-day average on Binance falling to -0.002, its most negative level since the post-COVID crash in April 2020. That means bears were paying to hold their bets, which is another echo of 2020.
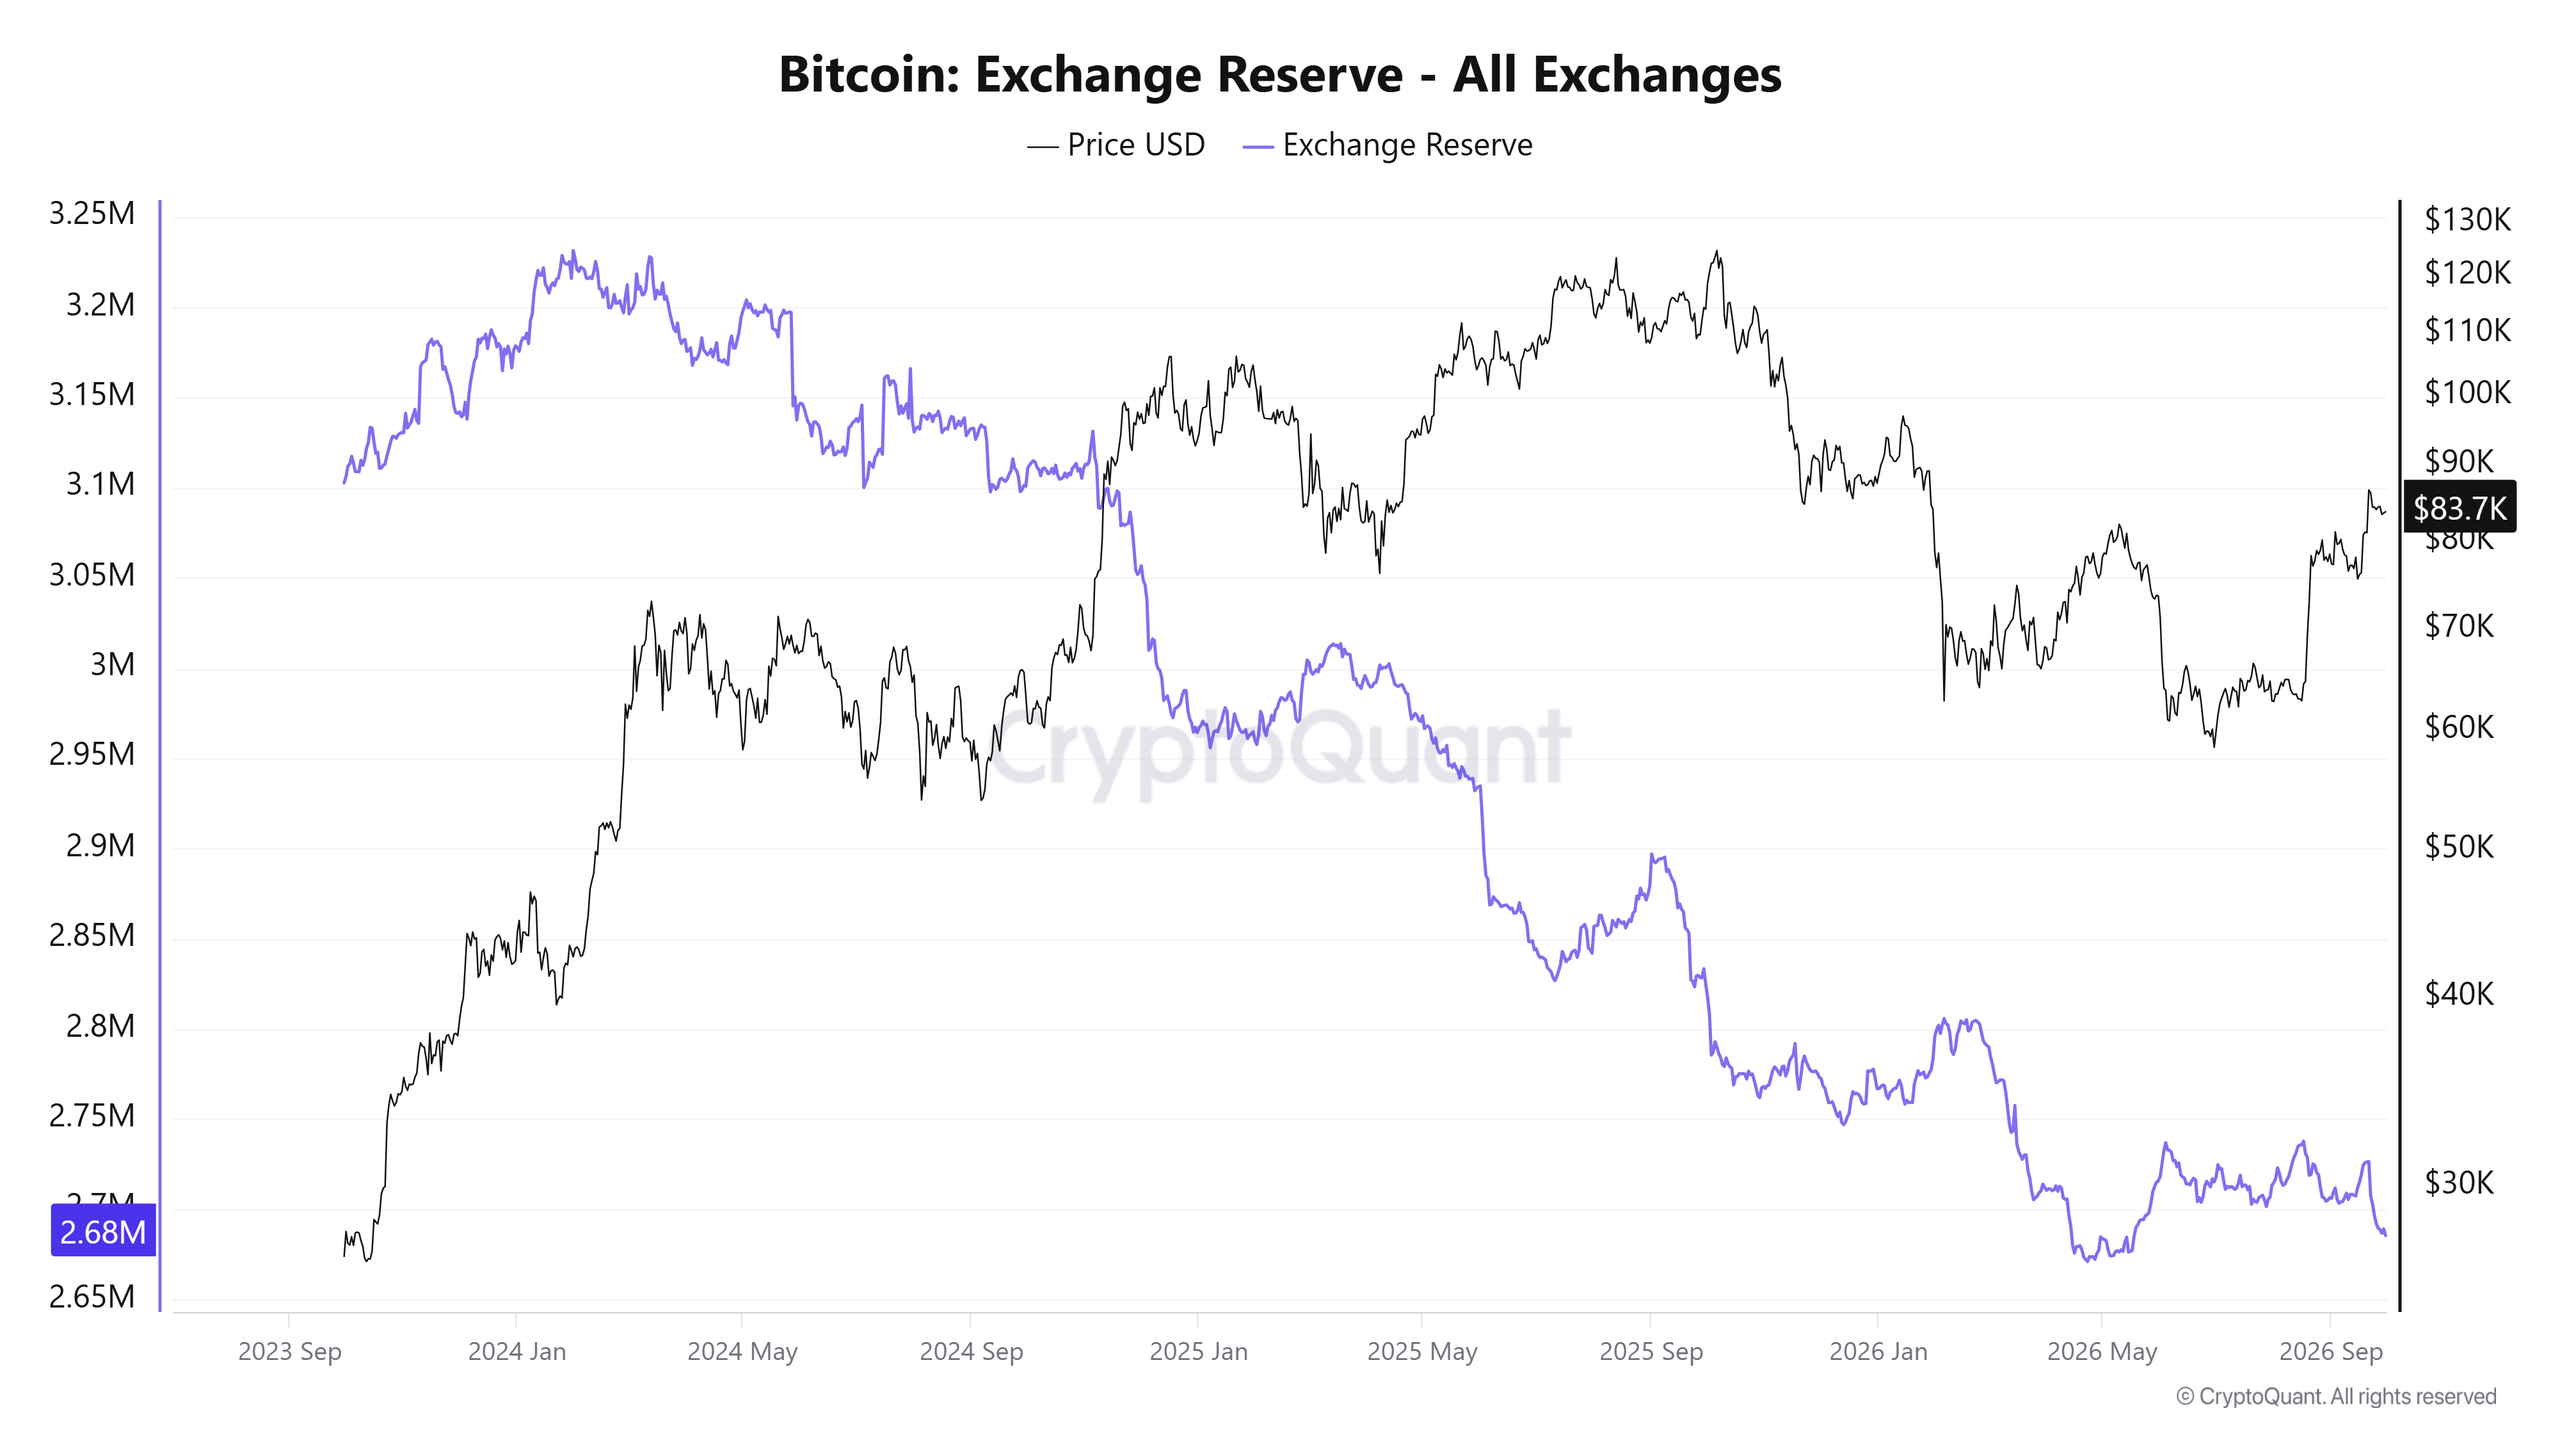
Reserves also point to accumulation. Binance’s Bitcoin holdings fell from roughly 701,000 coins on September 21 to 678,000 by September 28, a drop of about 23,000 BTC. The same report noted that the exchange’s USDT balance held near $38.1 billion. That is a lot of dry powder if it turns into buying.
Binance also matters to the story. CryptoQuant’s Q1 data put the exchange at roughly 34% of derivatives market share. When Binance traders lean one way, the whole market feels it.
Here’s a more natural way to say that:
The story has some weak points.
First, the buying signal is very small. A reading of 1.012 means that for every $100 of selling, there was only about $101.20 of buying. That’s barely more buying than selling. The source even admits it doesn’t show a huge imbalance of buyers. Its significance isn’t in its size, but how long it’s been going on.
Second, it’s looking backward. A 200-day average shows what happened over the past year, not what’s happening right now. Short-term numbers can change very quickly. For example, on September 29, one analysis showed a one-hour buy/sell ratio of 1.30, which sounds really strong. But the same report mentioned Bitcoin failing to break past $84,665 on lower volume. That means strong buying didn’t push the price up.
Third, the price hasn’t followed this buying trend. This is the part people miss. In 2020, this kind of buying pressure led to a massive price increase, with Bitcoin jumping from around $7,161 to $28,993, a 416% gain. Today, Bitcoin is trading near $83,517, still about a third below its all-time high of $126,080, even though this buying average is going up. Something is absorbing all that buying, or the buying isn’t as strong as it looks. One possible reason is the broader economy. The 10-year U.S. Treasury yield reached 5.27%, its highest point since 2007, which makes investors more hesitant to buy risky assets.
Fourth, not all buying is a good sign. This is the most important point. In a short squeeze, traders who bet against Bitcoin are forced to buy it back, and these are urgent market orders. These count as buyer activity. CryptoQuant itself suggested a recent price increase was due to a short squeeze on Binance, not genuine demand from new buyers, calling it the biggest squeeze in about a year. On September 21, over $648 million in short positions were closed as the price went above $85,000. So, some of the “buying pressure” in the data might be panic from people losing money, not confidence from new investors.
Fifth, other numbers from Binance aren’t as encouraging. In May, one analysis showed that only about 61% of Bitcoin was being held at a profit, compared to over 75% during stronger bull markets. That same report indicated that demand had fallen to its lowest negative level since the start of the year. Looking beyond Bitcoin, CryptoQuant found that about 84% of altcoins listed on Binance were trading below their 200-day average, after a weak period of about eight months. Also, the total amount of leverage has decreased.
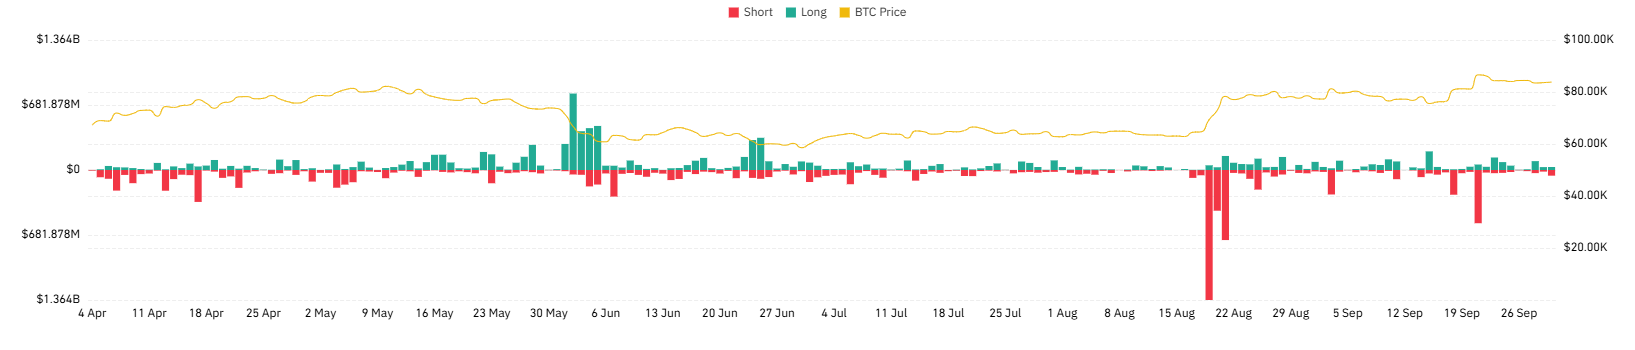
At the end of May, Bitcoin futures open interest across all exchanges was around $42.6 billion, a big drop from over $90 billion at its peak in early October 2025.
Sixth, how much Binance matters depends on who you ask. CryptoQuant’s figure for its share is about 34%. Coinglass showed Binance at 19.14% of futures open interest on May 31. While the methods are different, neither number means Binance is “the market.”
Seventh, history cuts both ways. CryptoQuant has said that readings around 1.02 coincided with reversal zones or strong volatility in previous periods, marking both the start and end of trends. In other words, high taker buying has shown up near bottoms and near tops.
The verdict
The claim holds up on the numbers. Binance’s long-run taker buying has flipped from sell-led to buy-led, and the turnaround from the 2025 low is sharp. It does not hold up as a promise. The average is slow, the edge is thin, the price is about a third below its high, and some of the buying may be forced covering rather than fresh demand.
Crypto headlines love a “back to 2020” line. But 2020 was followed by a fourfold rally, and that is the picture readers carry away. Knowing how this stat works, and what it can’t see, helps you tell an early signal from a lagging one. It also shows why one exchange’s chart should never be read alone. If you trade, or just follow the market, treat this as a sign that sentiment is healing. Do not treat it as a signal to buy.

Dan is a seasoned crypto writer for Blockchaindose who got his start in the space back in 2019. Over the past four years, he’s built a solid grasp of how the industry moves, focusing heavily on DeFi, NFTs, GameFi, and promising new projects.
Off the clock, you’ll usually find him buried in a good book or kicking back with a movie. His blend of hands-on market experience and straightforward commentary makes him a clear, trusted voice across the platform.