
Scroll through social networks like X, or other on-chain dashboards any day, and you’ll see talks of Bitcoin’s daily active addresses, either surging or dropping. The number making rounds when writing this report is 689,939. This represents the count of unique Bitcoin addresses that sent or received a transaction in a single 24-hour window, as tracked by on-chain analytics platforms.
It’s a real number. But, it is completely different from what many people assume.
The number everyone quotes, and what it actually counts
689,939! An interesting figure. It tracks the number of active addresses recorded daily primarily within the Bitcoin network.
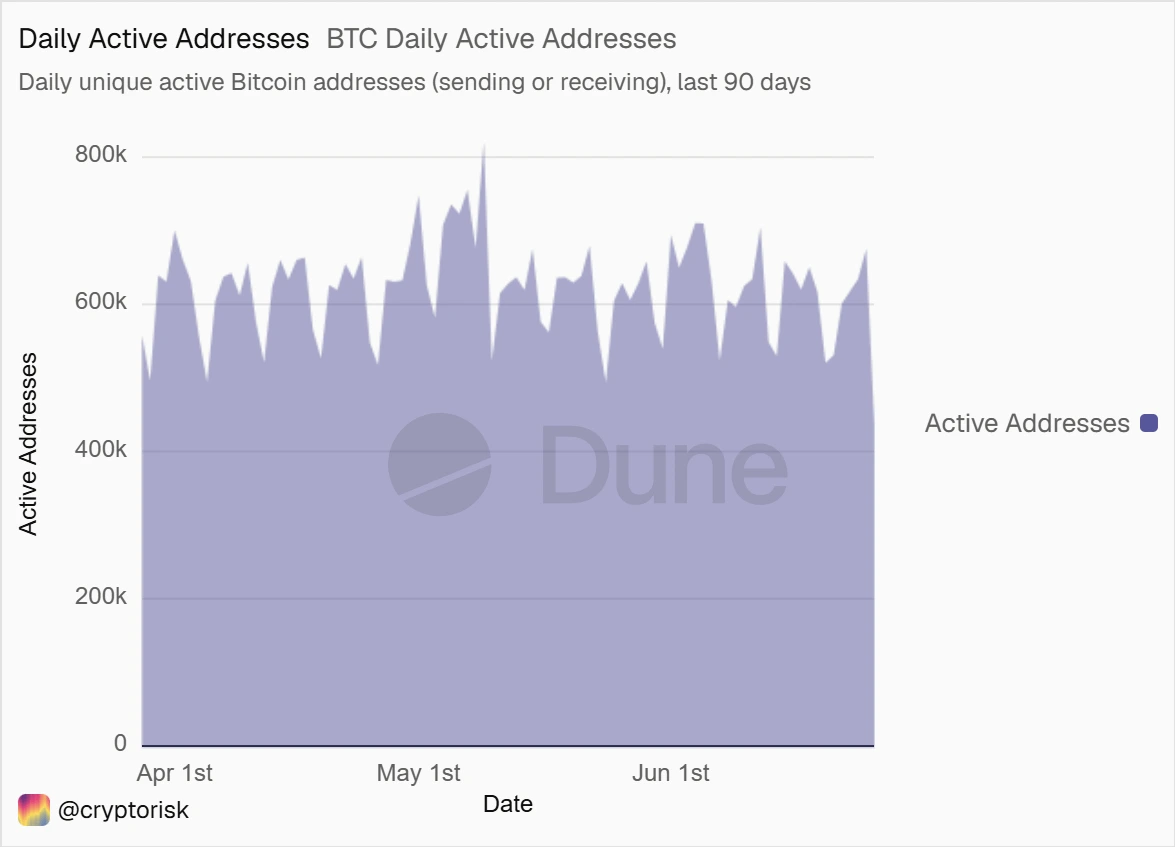
Based on charts by Dune Analytics, the number of daily active addresses on Bitcoin in the 90 day period preceding the writing of this report peaked above 800 thousand. In the same period, the lowest number of active addresses was slightly below 500,000.
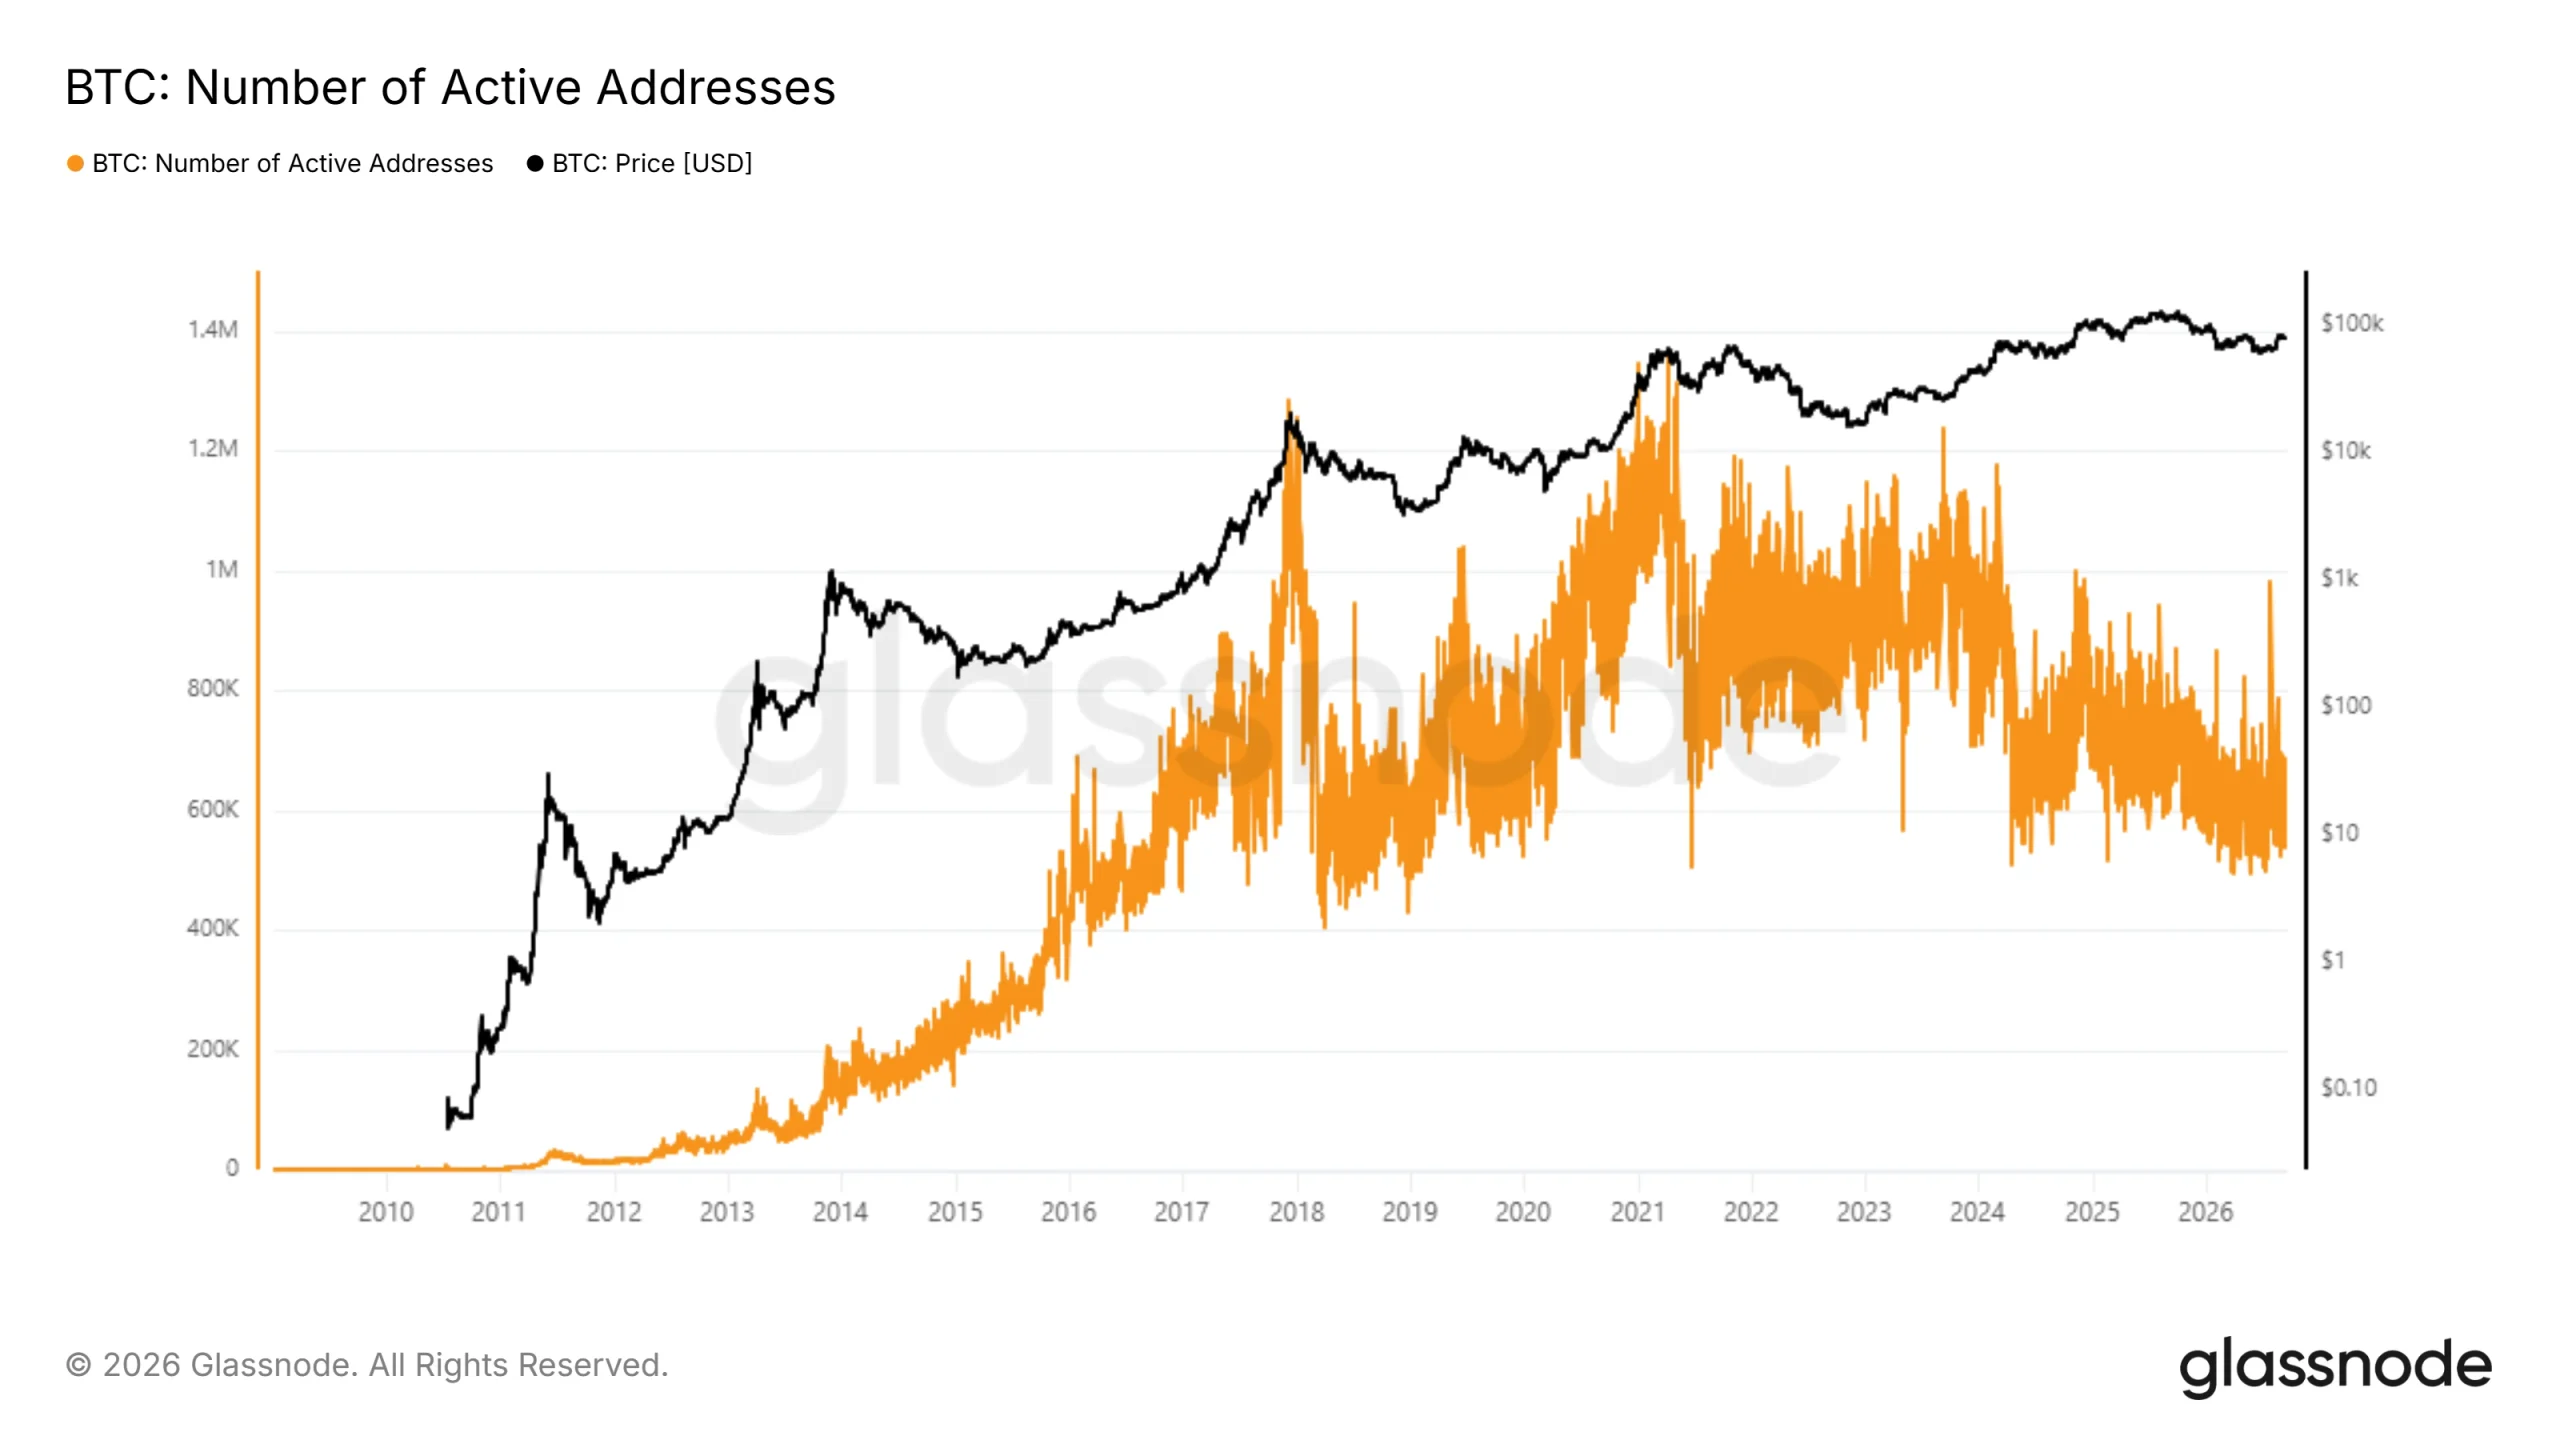
Glassnodes data analytics also goes deep into the data. It has tracked the number of unique Bitcoin addresses since the year 2010. In the charts, it is noticeable that during peaks of bullruns, the number of active Bitcoin addresses surges with the prices.
The 2017 and 2021 peaks are the best examples. In fact, the peak for daily active addresses is over 1.2 million, reported during the 2021 bull run.
Token terminal’s figures are also almost the same as the above mentioned figures. This shows some level of consistency in tracking methodology.
But again, are there 689,939 daily active users of Bitcoin? Well, that’s not really the case.
Glassnode, our main data source, says an active address is any unique address that sent or received something in a transaction within a set time. The definition is accepted by Coin Metrics. Both clearly state this metric tracks how many addresses are involved in ledger changes, not who owns them. Neither company claims to know who controls any specific address.
Notice that a bitcoin owner can create dozens of addresses in a single day, without adding a single user. For example, they might use a new address for receiving payments, another for spending, and automatically generated addresses for change from transactions. They might also use different addresses for long-term savings versus daily spending, or one-time-use addresses from their wallet software.
The reverse is also true. A crypto exchange, a custodian, an ETF, or a payment processor might represent thousands or even millions of customers using just a few on-chain addresses. One person can control many addresses, and one address used by a custodian can represent many people. The active address count doesn’t account for this; it just counts addresses.
Token Terminal now tracks the two metrics separately. It defines active users as “the number of unique addresses that make a revenue-generating transaction with a project, i.e. an application or a blockchain.” However, Token Terminal’s active user charts seem to be almost the same with daily active address charts. This suggests that we cannot really rely on the charts to understand the difference between active addresses, and users.
The numbers for active addresses have been reported differently by various platforms. Some public data shows a peak of about 938,609 addresses on August 8, 2023. It dropped to around 655,908 by March 25, 2026, and then recovered slightly to the 660,000-675,000 range by early August 2026. This is a drop of about 30% from the high to the low, followed by a leveling off instead of a full recovery.
This does represent a real and significant decrease in activity seen on the main blockchain. However, it doesn’t necessarily mean the user base is shrinking, because activity on the main blockchain and the number of users aren’t the same thing. This is especially true in a year where Bitcoin ETFs, corporate funds, and custodial services have moved a lot of activity off the main network.
It is also interesting to see that Bitcoin, the largest blockchain network in 2026, reports less daily active addresses and users when compared to other chains. Leading the race, according to Token Terminal is Tron, with over 3.8 million daily active users. Others like World Mobile Chain, BNB Chain, Solana, and Ethereum all come before Bitcoin which currently sits at eighth.
Addresses Are Moving in Opposite Directions
While this article puts keen focus on the number of active addresses, our research discovered that many metrics based on addresses are moving in opposite directions.
Fidelity Digital Assets’ research on on-chain activity in Q2 2025 provides a clear example. During that quarter:
- Monthly active addresses went down by about 2.9%.
- The creation of new addresses decreased by about 3.6%.
- The number of transactions fell by nearly 12.8%.
- Addresses holding at least $1,000 worth of BTC increased by 16.2%.
Fewer addresses were being used for transactions, but more addresses were holding significant value. Fidelity’s own count of addresses holding over $1,000 in BTC grew from about 5.3 million at the start of 2023 to nearly 13 million by mid-2025. This came even as the number of daily transactions declined.
Some of the explanations offered via Fidelity’s researchers include:
- Increased use of spot Bitcoin ETPs and other ways to invest off the main blockchain
- More long-term holders trading less often
- Big institutional transfers going into fewer accounts
- Better ways to hold assets securely
- More people are using Layer-2 systems that don’t show up as regular activity on the main Bitcoin network.
You can’t see all of this by just looking at one number for “active addresses.” You need to compare different measurements to get the full picture.
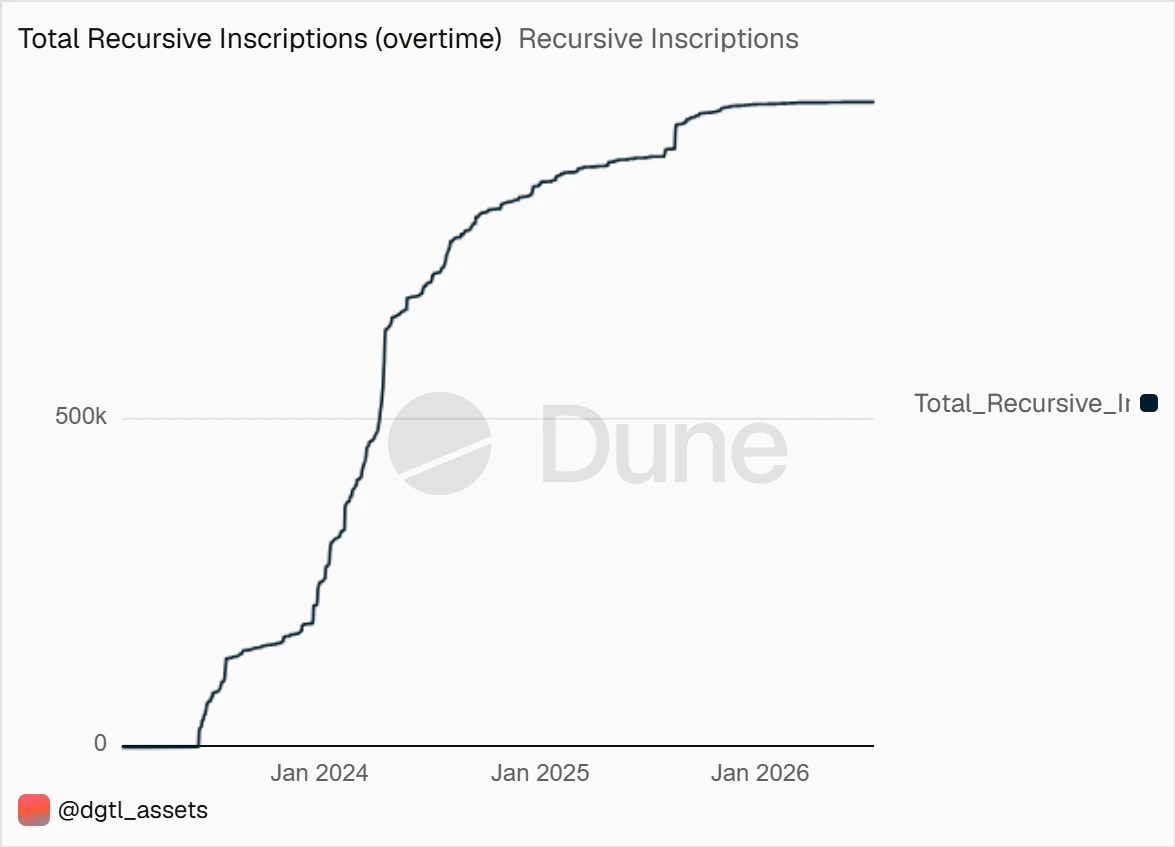
Bitcoin ordinal inscriptions complicate the picture.
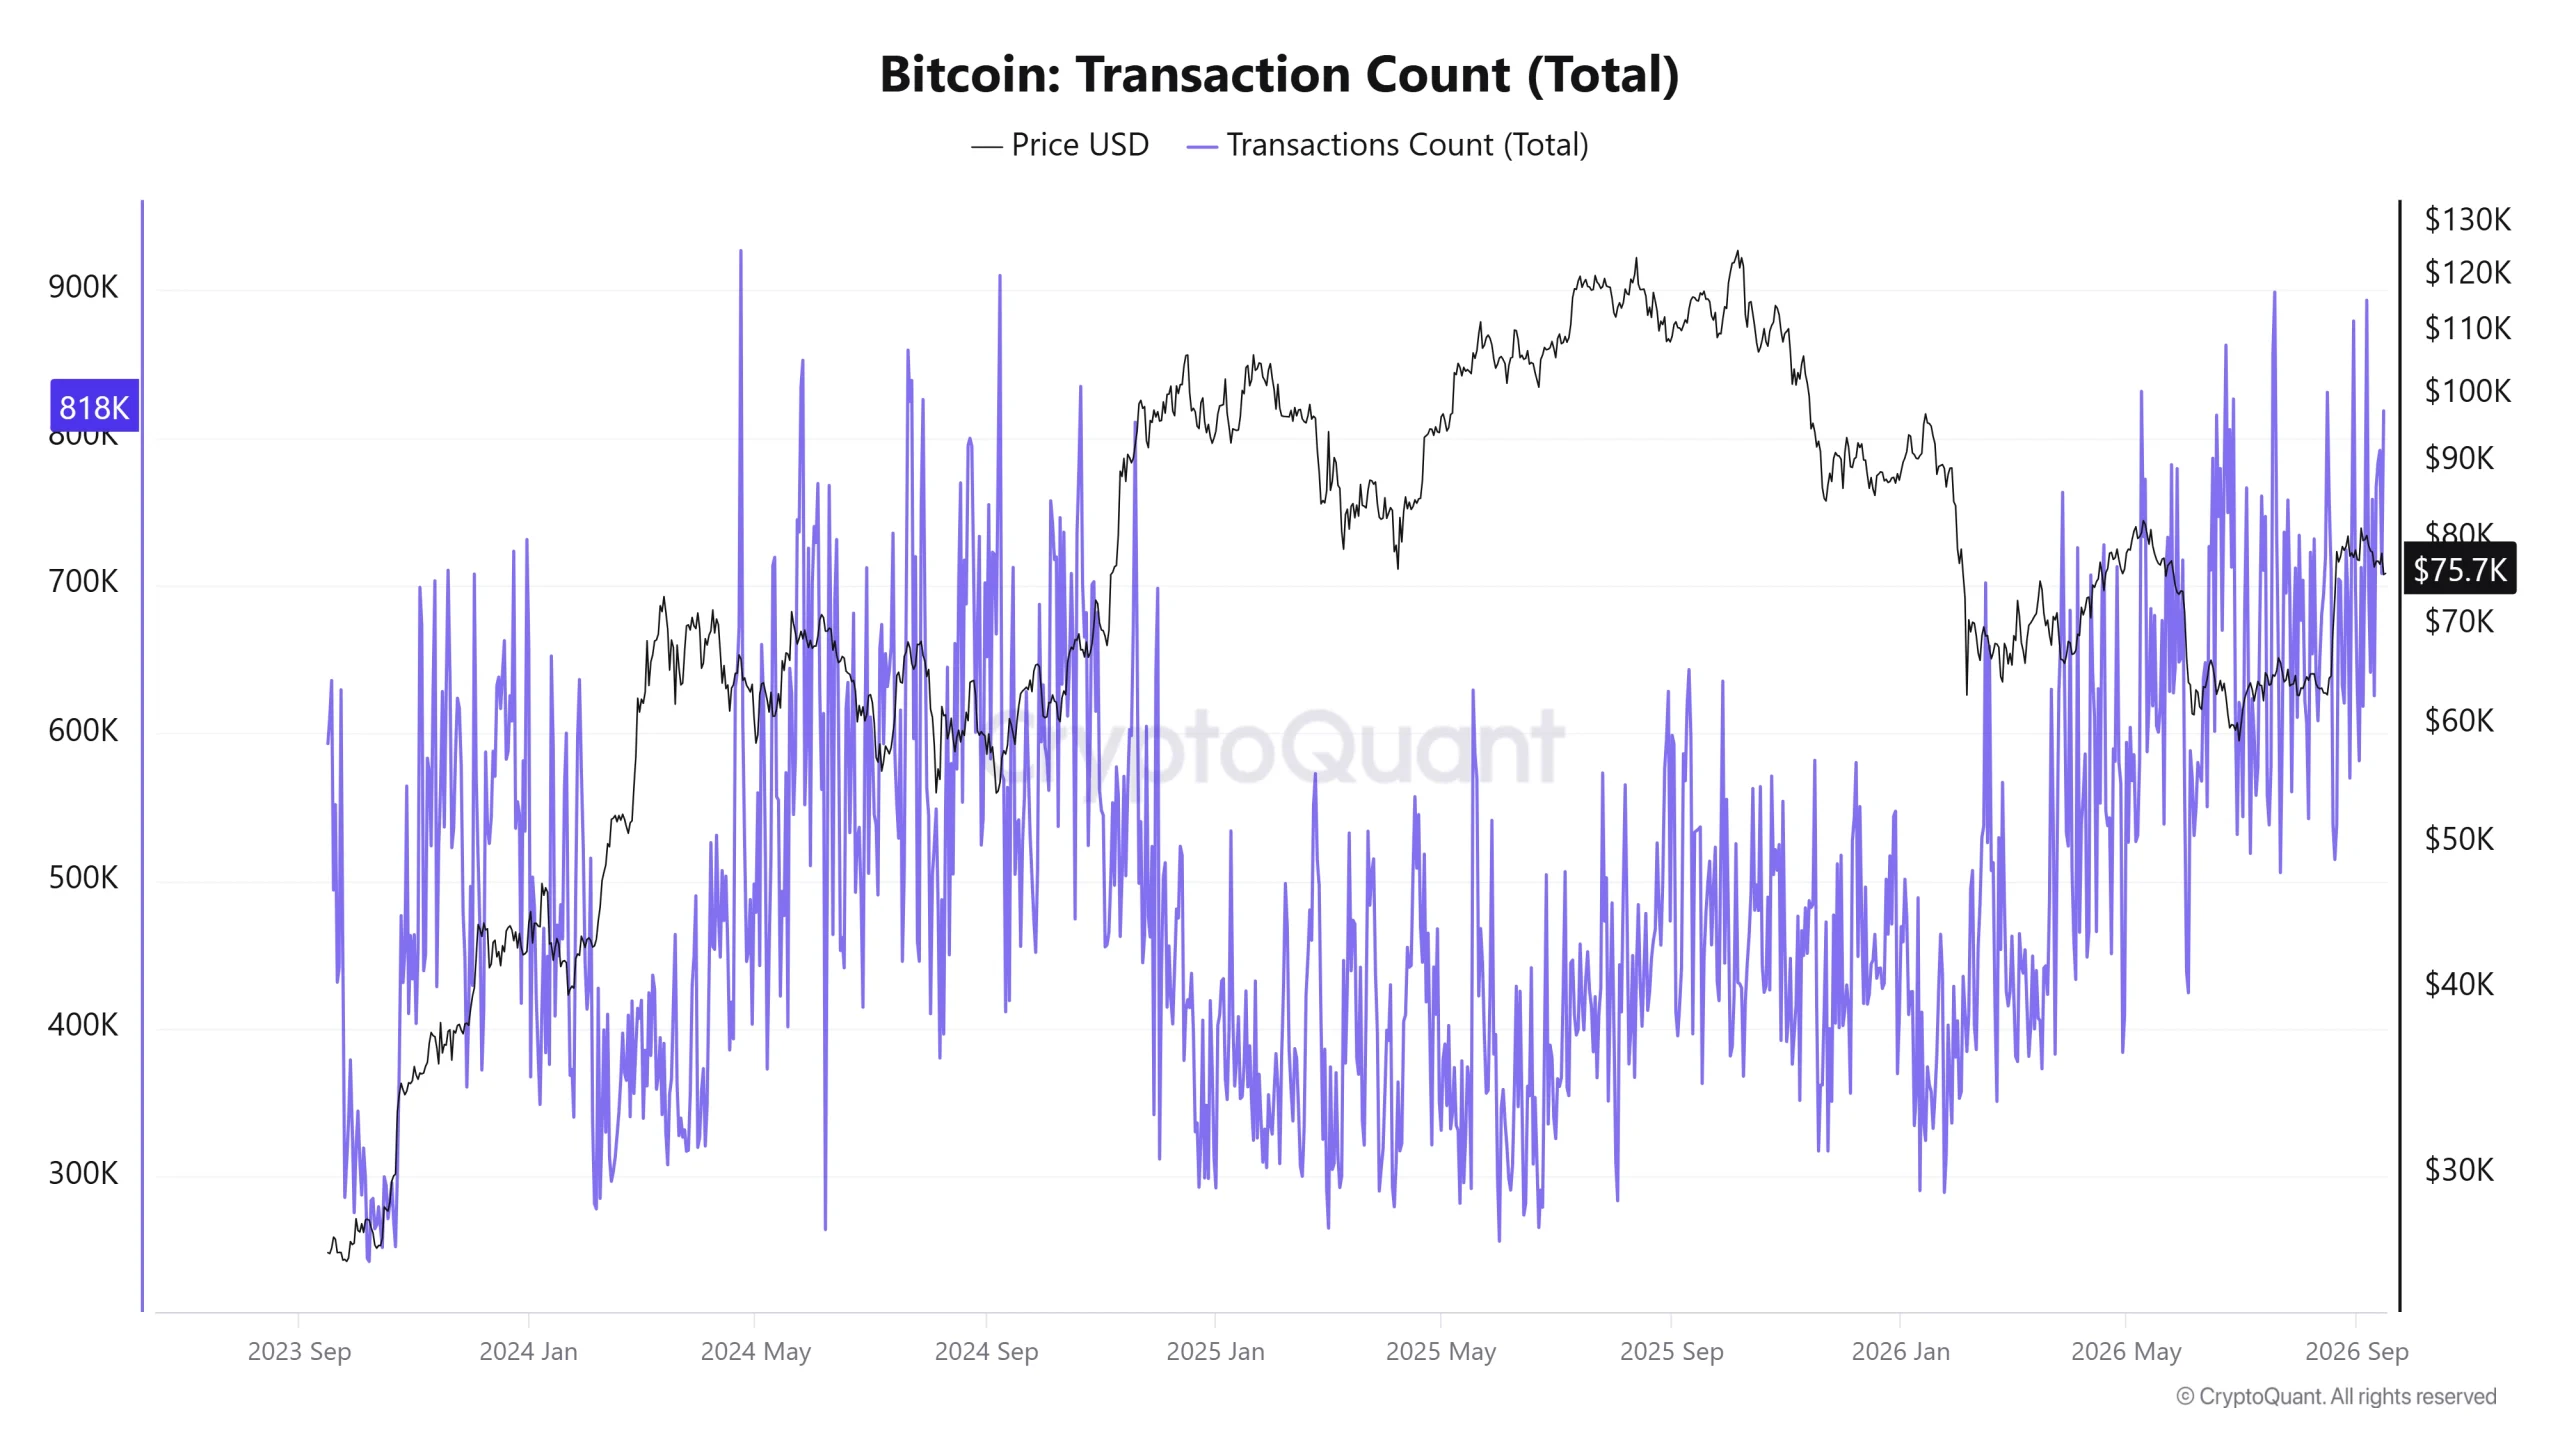
The metrics for Bitcoin’s active addresses and transaction counts were also skewed, but in the opposite direction, by activity related to inscriptions. Data from Glassnode in 2023 shows that inscription transactions added between 175,000 and 356,000 transactions per day at certain times that year. At times, these transactions made up about half of all confirmed transactions on the network. Yet, they only used about 10-15% of the blockspace.
Instead of many users being hidden behind one address, protocol activity can make it look like there’s more economic activity happening than there really is. This happens without a proportional increase in actual users.
A better dashboard than one number
Serious researchers studying the blockchain increasingly believe that no single metric for addresses can tell the whole story about adoption on its own. A more accurate way to look at the data would involve analyzing several different layers at the same time.
| Question | Better metric | What it captures | Main limitation |
| Are addresses transacting? | Daily/weekly/monthly active addresses | Recent participation | Address ≠ user |
| Are balances being distributed? | Non-zero addresses, balance bands | Breadth of funded ownership | Multiple addresses, dust |
| Are meaningful transfers happening? | Economically active addresses above a USD threshold | Activity above a minimum value | Threshold and price sensitivity |
| Are independent entities transacting? | Entity-adjusted active addresses/volume | Estimated economic participants | Heuristic clustering, imperfect |
| Is adoption happening off-chain? | ETF assets, exchange balances, custodian disclosures | Financial exposure and custody growth | Often not directly attributable |
| Are people using Bitcoin without touching the base layer? | Lightning Network and Layer-2 stats | Non-main-chain usage | Coverage gaps |
At Coin Metrics, there’s a metric named “economically active addresses” which filter for transfers above a preset dollar threshold. At Glassnode, there’s entity adjusted figures that cluster cluster addresses believed to share a common owner. The two metrics are steps toward something closer to a real user estimate.
Why any of this actually matters
Active-address counts get cited in investment research, media coverage, and policy discussions as shorthand for “how many people use Bitcoin.” This however, distorts the debate, and fails to explain a lot. A dip gets reported as fading interest even when balance-holding is climbing, while a spike from inscription activity or address churn can get reported as a wave of new adopters that never actually arrived.
And, these numbers often affect lots of decision makers. The fix? Just read active addresses as a measure of address activity. Cross-check this data against balance distribution and entity-adjusted data, and resist the headline that collapses all of it into one deceptively simple number.

Dan is a seasoned crypto writer for Blockchaindose who got his start in the space back in 2019. Over the past four years, he’s built a solid grasp of how the industry moves, focusing heavily on DeFi, NFTs, GameFi, and promising new projects.
Off the clock, you’ll usually find him buried in a good book or kicking back with a movie. His blend of hands-on market experience and straightforward commentary makes him a clear, trusted voice across the platform.