As we move closer to 2025, Bitcoin (BTC) is once again in the spotlight. Investors and traders are asking the same burning question: Will Bitcoin finally surpass $100,000, or will it first take a dip toward $48,000? The BTC/USDT trading pair gives us critical insights into possible market movements. This analysis will break down key indicators, price trends, and important support and resistance levels to watch.
Key Indicators: Moving Averages and RSI
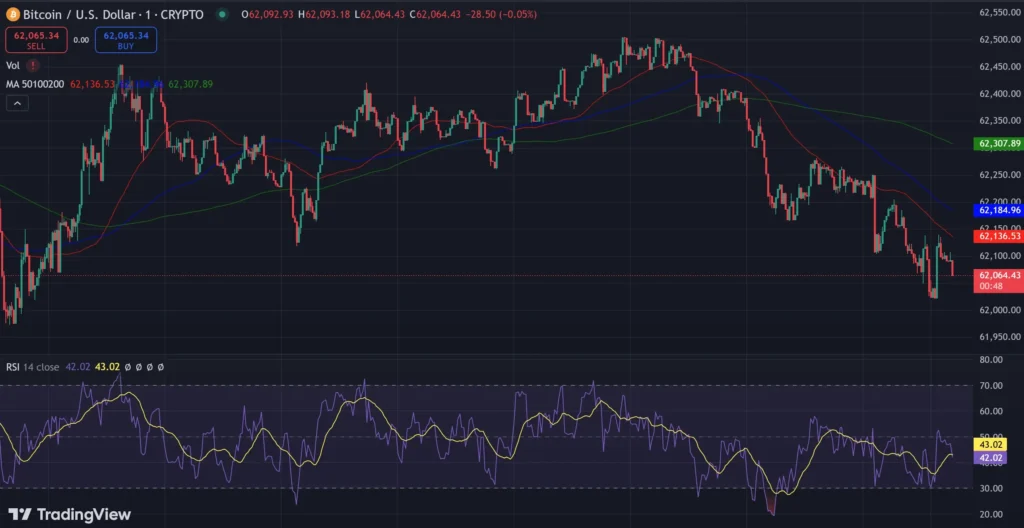
- Moving Averages (MA): BTC is hovering around its 50-day ($62,136) and 200-day ($62,307) moving averages. A break above could push BTC to $65K-$68K. Failing to hold these levels might lead to a dip toward $58K-$55K.
- RSI (Relative Strength Index): At 43, BTC is in neutral territory. A move below 30 could signal a buying opportunity around $50K, while breaking above 50 may indicate bullish momentum toward $65K.

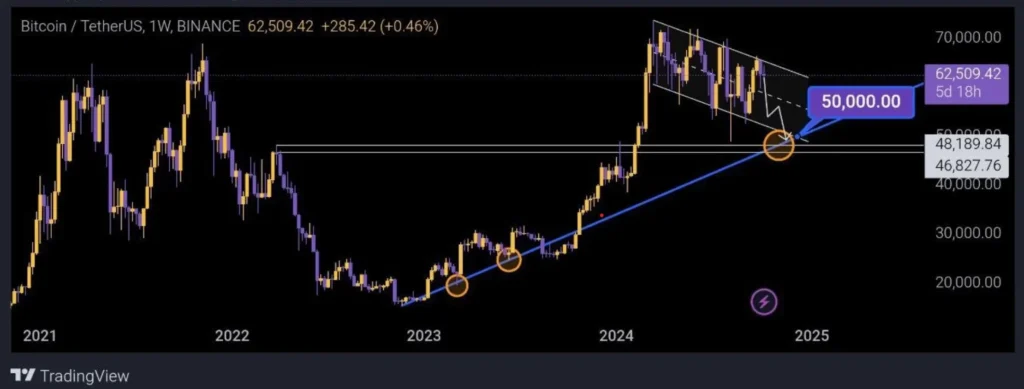
Will Bitcoin Retest $48K Before Climbing to $100K?
The long-term trendline suggests BTC could retest the $48,000 to $50,000 zone before making a push toward new highs. The critical levels are $48,189 and $46,827, which have acted as support in the past. If these levels hold, a bounce to $65K or higher could follow.
Key Levels to Watch
- Support Levels:
- Immediate support: $60K-$58K
- Critical support: $50K-$48K
- Resistance Levels:
- Immediate resistance: $62K (50 & 200-day MA)
- Next target: $65K-$68K
- Major resistance: $72K-$75K

Takeaways for Traders
- Watch for a possible dip to $50K, which could be a strong buying opportunity.
- Monitor the RSI and moving averages for signs of a bullish reversal.
- Prepare for a breakout if BTC clears the $65K-$68K range.
Conclusion: A Crucial Move Ahead for Bitcoin
Bitcoin is at a critical point. Whether it dips to $48K or surges to $100K, 2024 will be a defining year for BTC. Stay sharp, watch key levels, and be ready for any outcome.


