In today’s market update, we’ll explore the correlation between Bitcoin and the GMI Liquidity Index, providing insights into potential future trends. We’ll also analyze several key cryptocurrencies, including ATOM, AAVE, MKR, ZRO, and KSM, examining their current market positions and potential future movements.
Perfect Correlation — Bitcoin & GMI Liquidity Index
What is the GMI Liquidity Index? It offers a comprehensive overview of the balance sheets of major central banks worldwide. This index is particularly valuable as it provides data 12 weeks in advance, allowing analysts to anticipate potential future trends.
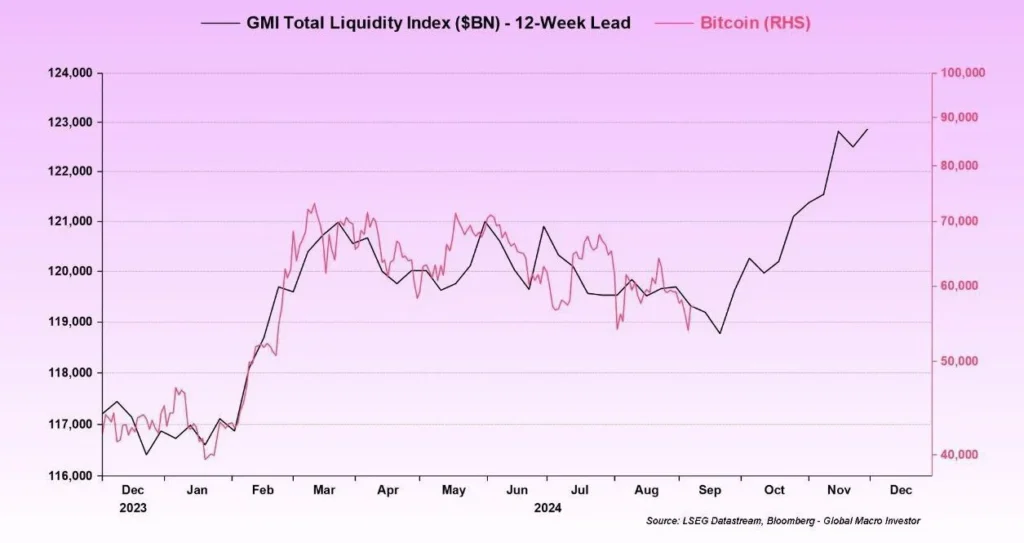
As you can see from the image, striking correlation between the two charts. At the onset of 2024, both the index and Bitcoin began to rise, followed by a period of fluctuation over the past six months. Notably, the GMI Liquidity Index is now signaling GROWTH, projected to commence in October 2024. Given the strong historical correlation, Bitcoin is expected to follow this upward trajectory, mirroring its performance throughout 2024.
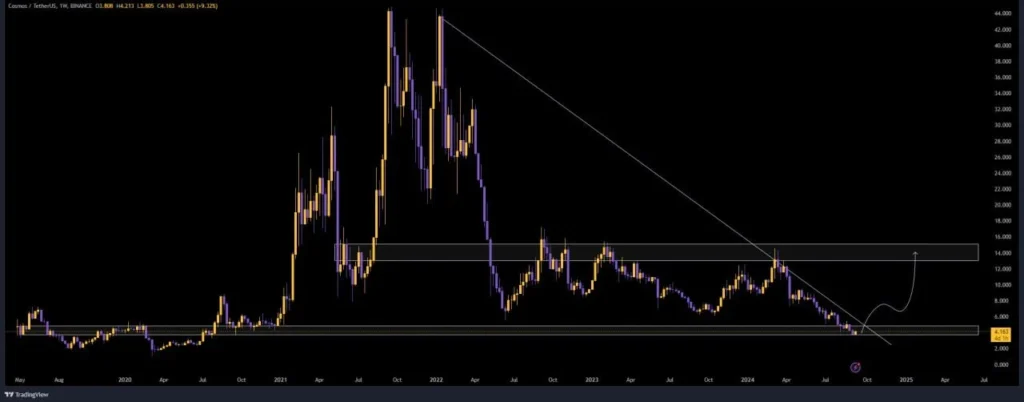
ATOM/USDT
Despite widespread criticism of Cosmos due to a lack of airdrops, this negative sentiment could potentially indicate a bottom in the ATOM/USDT chart.
We’ve been accumulating ATOM from $8 down to $4, anticipating a swift rebound to the $10 – $15 range.
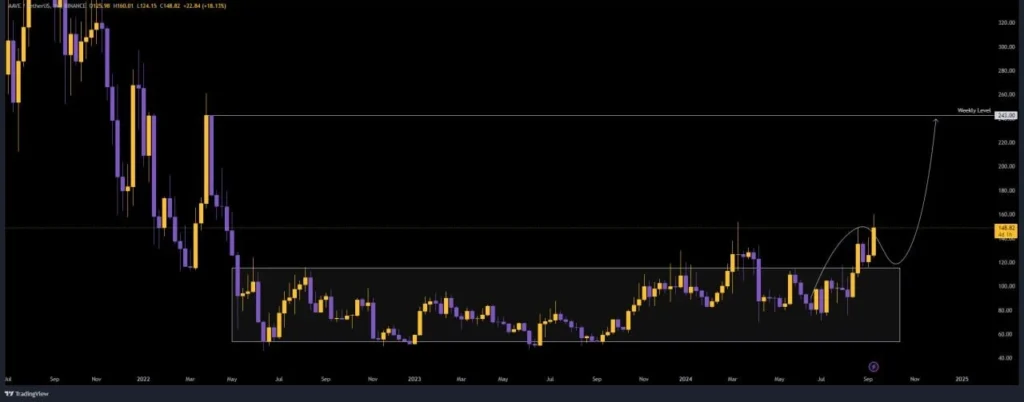
AAVE/USDT
AAVE appears to be emerging from an accumulation structure. Thanks to it, the whole DeFi Sector may Blast Off!
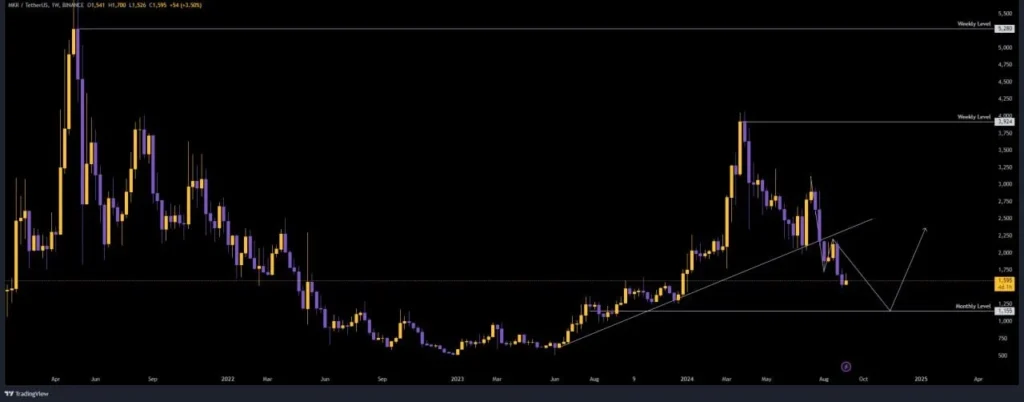
MKR/USDT
Maker, another prominent DeFi project that performed exceptionally well in the previous bull run, has recently broken below its primary trendline. Consequently, we’re anticipating a further decline to around $1,150.
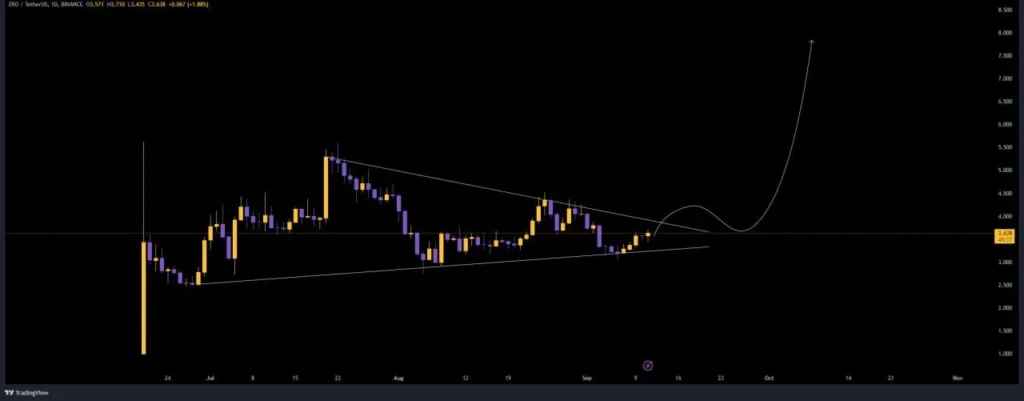
ZRO/USDT
Could this be the most bullish chart in the current market? With no vesting or token unlocks scheduled for the next 9 months and a modest market cap of $400 million, ZRO’s chart is displaying remarkable resilience.
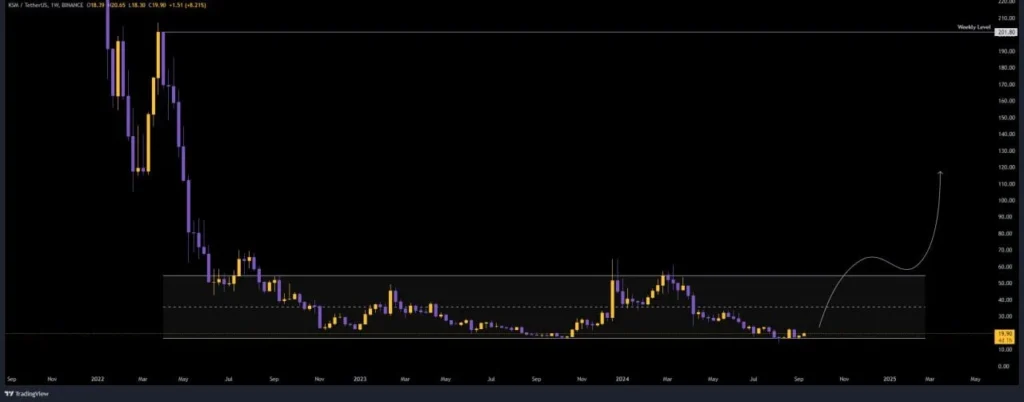
KSM/USDT
Kusama is presenting an attractive setup. Once it breaks out of its consolidation range between $20 and $60, KSM could potentially surge towards the $200 mark.
Today’s market update reveals intriguing trends across various cryptocurrencies. The correlation between Bitcoin and the GMI Liquidity Index suggests potential growth in the coming months. Meanwhile, altcoins like ATOM, AAVE, and ZRO are showing promising signs, while MKR faces some challenges. Kusama’s potential breakout could lead to significant gains. As always, make sure that you conduct your own research and consider their risk tolerance before making investment decisions.