Ethereum has shown strong bullish momentum in October, with signs pointing toward a significant upward move. With key resistance levels breached, the current price action suggests that ETH could be on track to hit $3500 by the end of November. This article will break down why this move is happening and what investors can expect in the coming weeks.

The Power of the “Power of 3” Pattern
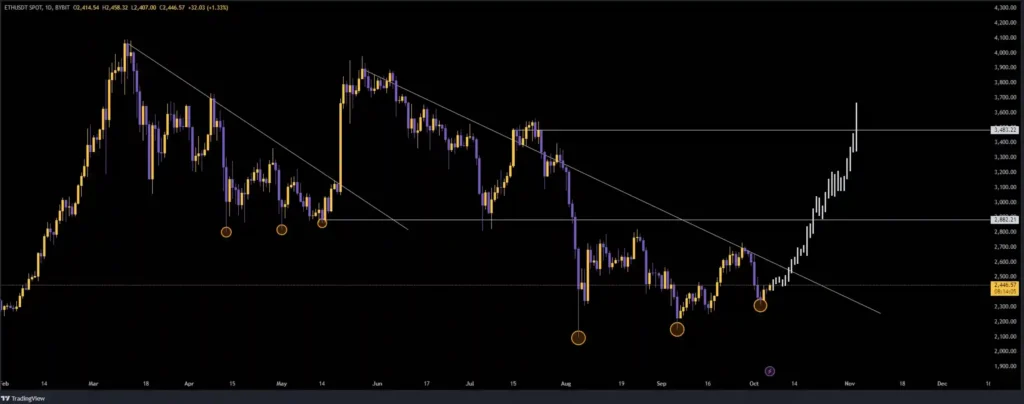
The recent chart shows the “Power of 3″ pattern, a technical setup that traders often watch for when looking at price reversals or breakouts. This pattern appears when a price hits key support points three times, suggesting that the downtrend is weakening. For Ethereum, the three touches of support at around $2,400 indicate a strong defense by the bulls, pushing prices up after every dip.
Key takeaway: Ethereum seems to have hit its short-term bottom, and with bulls defending the $2,400 zone, further gains look promising.
Moving Averages: A Key Signal
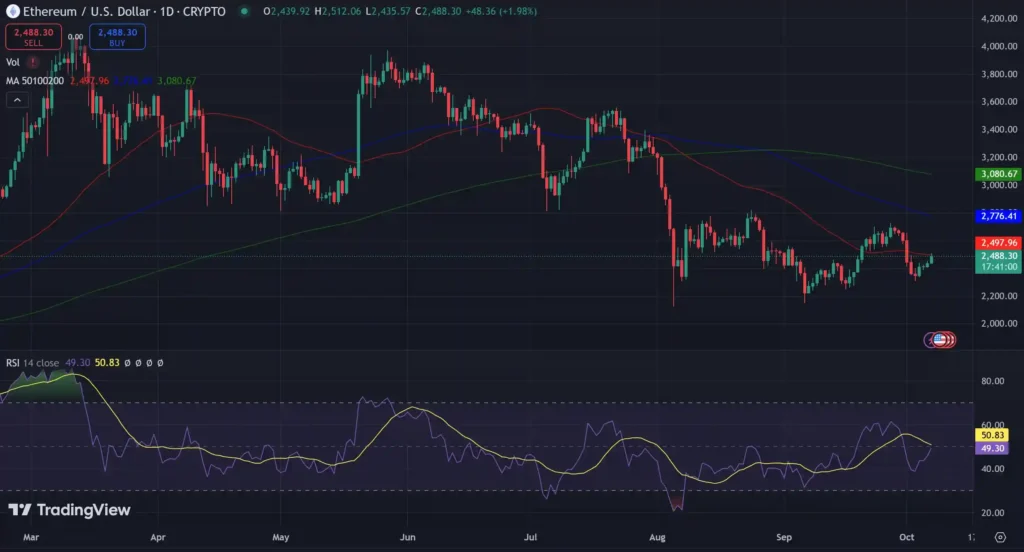
The chart shows two crucial moving averages (MA):
- The 50-day moving average (red) sits at around $2,776, acting as a near-term resistance.
- The 200-day moving average (green) is above at $3,080, indicating longer-term resistance.

Moving averages help smooth out price action and can act as support or resistance levels. Ethereum is currently trading below both moving averages, which suggests that buyers may face some resistance as they push toward the $2,776 level in the near term.
Key takeaway: A break above these moving averages could be the confirmation needed for a stronger bullish push.
RSI Indicator: Market Momentum is Building
The Relative Strength Index (RSI) on the 14-day chart is hovering just below 51, which means the market is in neutral territory. An RSI of 50 suggests that neither buyers nor sellers dominate the market right now.
However, the RSI is curving upwards, suggesting that momentum is slowly shifting toward the bulls. If the RSI moves above 60, it could signal the beginning of a stronger upward move.
Key takeaway: Momentum is gradually building. Keep an eye on the RSI to signal whether Ethereum is ready to rally or will experience more consolidation.
Prediction: $3,500 by November?
The second chart illustrates the breakout from a long-term downtrend. Ethereum has broken free from a descending trendline, which held it back for several months. With this breakout, the market is showing signs that a run to $3,500 is not only possible but could happen by the end of November 2024.
Many traders call this phase “Uptober”, a month traditionally marked by bullish movements across the crypto markets. If Ethereum follows this pattern, we could see a sustained rally over the next several weeks.
Key takeaway: The breakout from the downtrend gives confidence that $3,500 is a realistic target by November if current market conditions persist.
Final Thoughts: Is Ethereum Ready to Surge?
With the recent support levels holding strong and momentum building, Ethereum looks primed for a bullish move in the coming weeks. Traders should monitor key levels like the 50-day and 200-day moving averages, as well as the RSI for further confirmation. If Ethereum can push past the $2,776 resistance and sustain its momentum, a target of $3,500 by November seems within reach.
What to watch:
- RSI moving past 60 could signal a stronger bullish push.
- Breaking the 200-day moving average at $3,080 would signal a significant shift in market sentiment.
- Support at $2,400 is critical. If this level breaks, the bullish outlook may shift.
This analysis gives Ethereum holders and traders a clear roadmap for what to expect and what to watch in the coming weeks. Keep an eye on these key levels and indicators to make informed trading decisions.
Please note that this analysis is for informational purposes only. BlockchainDose does not provide financial advice, and we are not responsible for any investment decisions made based on this analysis. Always conduct your own research and consult with a financial advisor before making any trading or investment decisions.


